For today, yesterday's sharp internals suggested a 1-day oversold event and a probable close in the green today, this "may" be a bit longer than 1-day, but I don't expect much longer if at all which we'll see later today as the charts further develop. From last night's Daily Wrap in internals and their next day reaction...
Although the Dominant Price/Volume Relationship was mixed...
"Tonight the Dominant Price/Volume Relationship is mixed. The NASDAQ didn't have one. The Dow and SPX were both Close Down/Volume Up, with 22 and 249 stocks respectively. This is a 1-day oversold condition and usually sees a green close the following day. "
Much more importantly were sector performance indications suggested clearly a 1-day oversold condition (this is not the same as indicators' oversold, but based on breadth which is much more reliable)...
"Interestingly at the same time, 9 of 9 S&P sectors were in the red, Energy led to the downside. Among the Morningstar groups ONLY 14 OF 238 SOTCKS CLOSED GREEN. THIS IS AN EXTREMELY DEEP 1-DAY OVERSOLD CONDITION. ALL IN ALL, JUDGING BY INTERNALS ALONE, I'D EXPECT A 1-DAY BOUNCE OR A GREEN CLOSE TOMORROW."
In addition we have options expiration.
This is my initial take on what I'm seeing this morning (some of the short term 1 min charts may be already a little untimely, but still have a point to make).
As was seen and noted in the A.M. Update,
" ES knee jerked lower, but looks ready for an intraday move higher."
So far, along with 1-day oversold internals, yesterday's 1 min positive and this morning's positives in Index futures...


This is why I chose UVXY (2x long VIX short term futures) yesterday rather than VXX calls, Trade Idea: VXX / UVXY Long , it gives me some leverage and some room on the wild card/unknown (as of yesterday) event of payrolls, but still allows me to hold the position without too much draw down in to next week where the market is shaping up to get even uglier.

As for Treasuries/TLT... As you know I'm expecting a strong counter trend move once they wrap up their base/reversal process which I believe is nearly done. Remember we just closed TLT puts earlier this week for a near 40% gain on a short term trade, the reason why is I believe the larger counter trend bounce base was about to be finished up and so far it looks like that was the right call.


As for oil, I closed USO's short term put position yesterday for a 40+% gain expecting it to see a short term bounce in which I'd like to open a new put position...

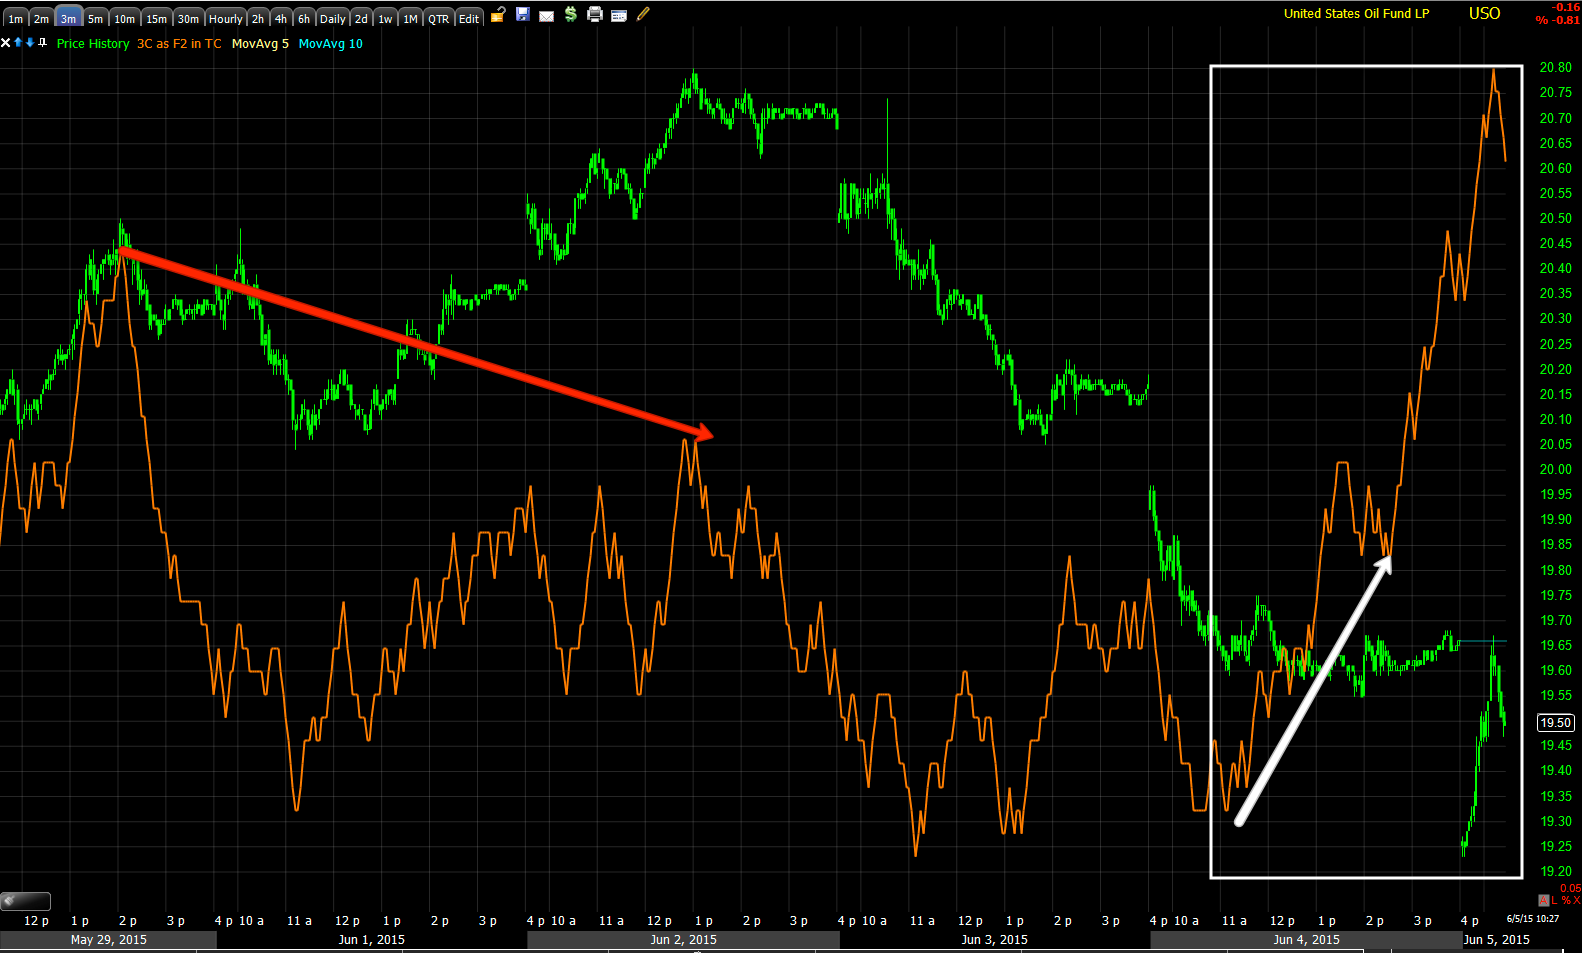

As USO's longer term 15 min chart still reflects more downside for USO before it is ready to finish up its longer term base.
As for the watch list assets/trade set-ups like the recent NFLX Trade Set-Up, many, like NFLX, are moving in the right direction for the trade set-ups I was looking for and hoping we'd see before the market sees too much damage and downside.


NFLX's short term 1 min chart suggests it will move toward our short area, letting the trade come to us as the broader market and watch list charts are in bad condition.
For now I'll continue to hold UVXY long, I suspected some near term volatility and the UVXY long rather than VXX calls allows me to better weather that near term volatility, but still have a position in place and be prepared in case Payrolls went the other way and as you can probably tell, I am feeling pretty good about the market falling apart very soon, hopefully not too soon that we can't get off our new short positions like the NFLX example as we need the trade to come to us for the best entry, lowest risk and best timing.
So far we aren't far off from the projections posted this week and specifically yesterday.
Remember, one of the worst looking charts for the market is HYG's (High Yield Credit) leading dislocation in price vs the SPX, this is already on long term primary charts, intermediate charts and now shorter term timing charts.

HYG (red) vs the daily SPX (green), this dislocation is very serious considering how badly longer term HYG charts are already dislocated from the market to the downside.


No comments:
Post a Comment