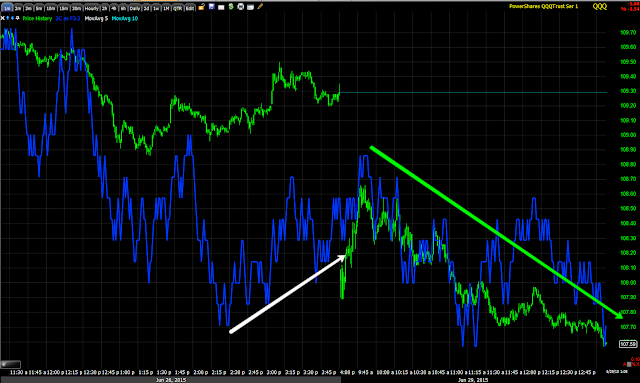
Earlier the charts for QQQ and VXX as interpreted with regard to very short term price action were early hints at what seems to be developing.
I'll start with the Index futures and work out to the bigger picture as the cash market 3C charts have caught up.
Es / SPX futures intraday 1 min with the cash open at the green arrow. I haven't marked the divergences on the chart, but rather the divergence area, I think you should be able to see where 3C diverges away from price creating an earlier negative divergence and a current positive divergence, but remember this is a 1 min intraday chart so keep the divergences in perspective.
We have almost the exact same thing for TF /Russell 2000 futures, also with a cash open at the green arrow, a negative divergence earlier and a slight, 1 min (weak) positive divergence working out now.
QQQ
The 1 min intraday chart shows an early opening positive divergence and since we have had intraday confirmation at the green arrow.
However the 3 min chart is showing a stronger intraday positive, although it must be kept in perspective.
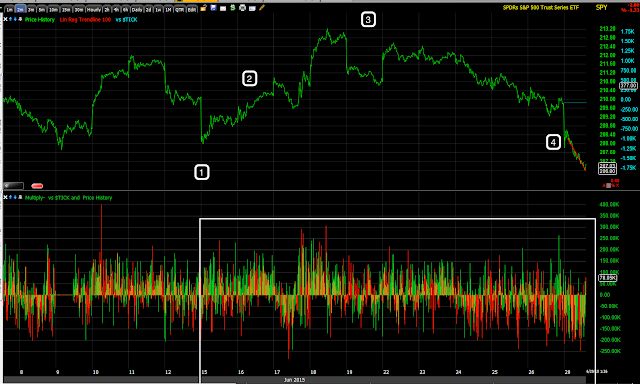
This is the 3 min 3C / QQQ trend since the June 15th mini-cycle labelled with stage 1, stage 2 mark-up, stage 3 top/reversal process and stage 4 decline. Note the positive divergence to the far right, but keep it in perspective vs. the large leading negative divergence at stage 3
QQQ 30 min chart is the strongest of all the above, it is also showing the area of the June 15th mini cycle which was a bounce off the SPX 150-day moving average as you might recall. Note stage 1 (base), stage 2 mark-up, stage 3 distribution/top and stage 4 decline as well as the negative divergence where it should be and the in line status with no current positive divergence because it is far too weak to show up on a strong underlying trend like this, again keeping it in perspective.
SPY
1 min intraday slight positive currently.
3 min is closer to in line, but could lock in a positive divergence with some slight 3C upside from here.
SPY 5 min for some perspective with the May head fake/false breakout from the SPX's nearly all of 2015 range/ascending triangle , which saw strong distribution making it a likely late stage 3 head fake which we most often see (in all timeframes) right before a transition to the next stage which in this case is stage 4 decline which is what was expected and forecast as early as April 2nd in detail including the bounce off support near the 100 and/or 150 day moving average for the SPX.
SPY 10 min showing the May 6th/7th accumulation we saw market wide which was the "Gas in the tank" that lead to the May head fake move in yellow. Note the 3C trend/distribution at the head fake and since including the June 15th mini-cycle which is labelled as stage 1, 2, 3 and 4 with 3C at a new leading negative low as the June cycle's stage 4 decline is a resumption of the larger primary trend's stage 4 decline from the May false breakout/head fake area which was distributed.
As for intraday breadth, the NYSE TICK
It has been range bound all day, although volatile.
Our custom TICK indicator intraday showing the earlier negative trend and a positive trend I saw early on, as it was just a hint.
And the longer term TICK through the entire June mini-cycle just to show you the different breadth at the different stages. Note the negative divergence in breadth at stage 3 top/highs and increasing as stage 4 transitions in.
As for the IWM, I'd like to say there's good confirmation, but it actually looks worse than the other two...
There is an intraday positive forming on the 1 min, but...
After that at the stronger 2 min chart it is in line with the downtrend/stage 4.
As is the 3 min chart with the 4 stages of the June 15th mini-cycle, now in stage 4 decline.
The 5 min IWM with VERY clear distribution in to stage 3 and at stage 3 with confirmation in to stage 4 decline as it leads negative strongly.
IWM 10 min also showing the June mini cycle to the right with heavy distribution in to the stage 3 top/distribution area transitioning to stage 4 decline with a deep leading negative divergence, thus it looks worse than SPY/QQQ.
IWM 30 min.
So I think it's probable we get a chance to open a new QQQ put at slightly better levels with longer expiration as well as VXX calls, but the main trend or core positioning is clearly leading negative as was forecast on April 2nd after we saw a head fake/false break out attempt (May) and then a move lower ultimately challenging the October lows for a new lower low in the primary trend which could reclassify the entire market's primary trend toward a bear market for the first time since the 2009 lows/base for the primary trend.
Is interest rates about to start going up?
-
Yes, I know - it does not make any sense - FED is about to cut
rates...but....real world interest rates are not always what FED wants it
to be.
6 years ago


No comments:
Post a Comment