This market update is not as comprehensive as I'd like it to be, but I want to get out something timely and I'll continue to add to it in following posts.
This is a chart and an excerpt from last night's
Daily Wrap dealing specifically with the "Week Ahead" forecast for early price strength in the week and a transition to weakness.
A gap fill, Doji star, but volume isn't high which tends to make these reversal candles very effective. We expected early week/Monday price strength, however that doesn't preclude tomorrow from putting in the daily candle/volume reversal I expect to lead to weakness through the rest of the week after the initial early price strength materialized (bounce from Friday), which was today.
In other words, a candlestick reversal today in volume wouldn't be outside of the realm of probabilities, but may in fact be the probability, although there's not a whole lot of intraday movement so far including internals, I expect that will change.
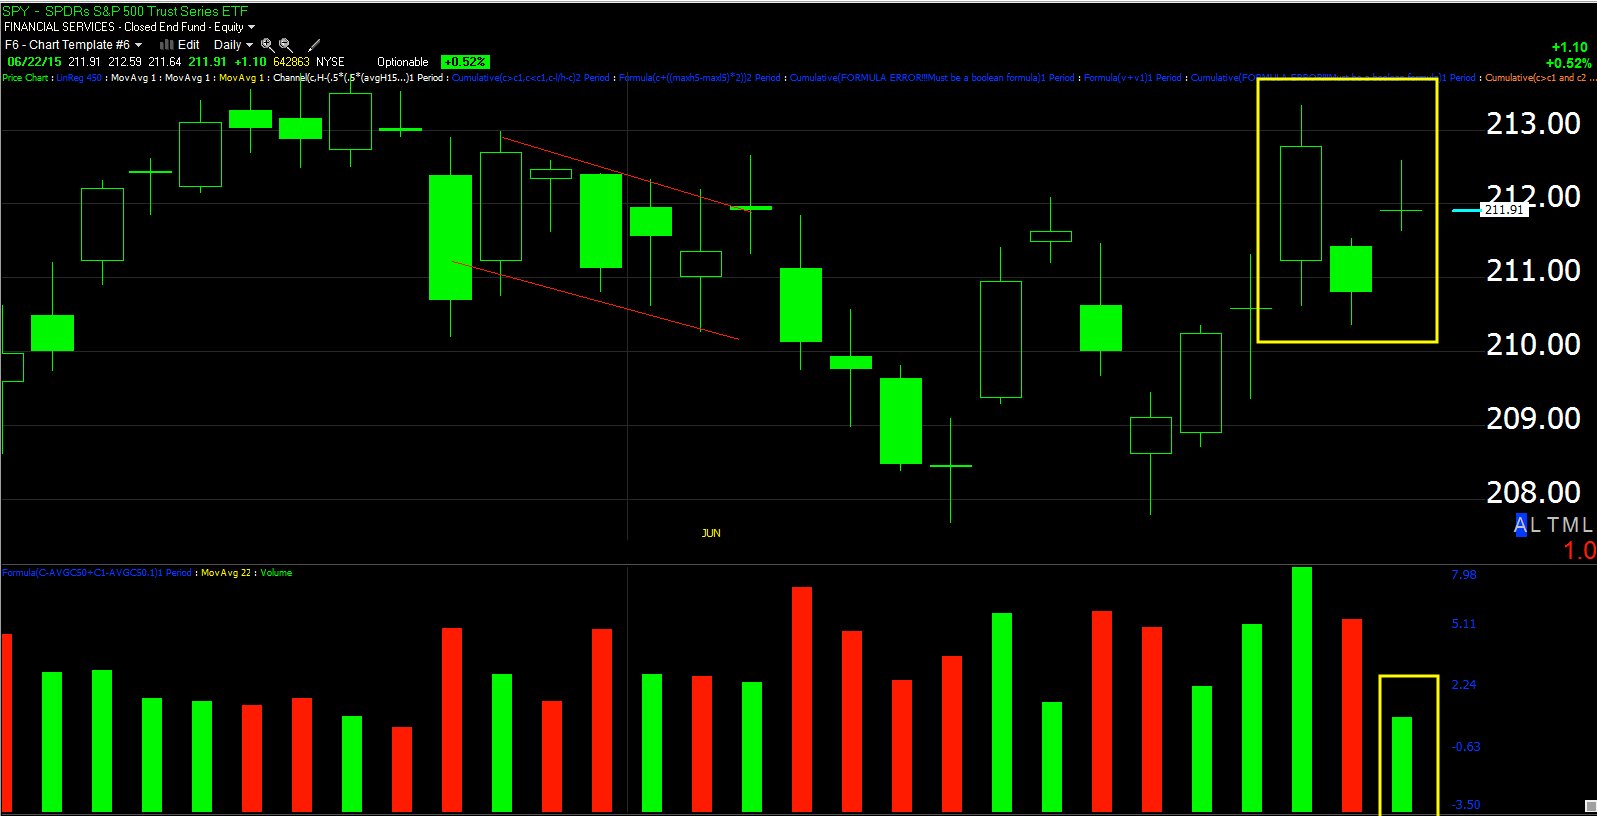
Looking at the daily SPY chart, which did have a Doji star reversal candle yesterday, but not the increasing volume that makes them 3-4x more effective, today could very well set up that candle.
While this is more of a gut feeling/guess-timate, the internals / Dominant Price/Volume Relationship from yesterday would be consistent with such a gut feeling.
The SPY with it's sentiment shake-up off last Monday's extreme fear on the Fear and Greed index, with way too many people leaning bearish Monday with a Hammer (upside reversal candle) on the same day and increasing volume. This looks like the end of that mini cycle or corrective move of the 150-day moving average which was something anticipated in the April 2nd forecast just as it was anticipated at different levels in the NFLX post from this morning (except I anticipated trouble at the 100-day SPX average which there technically was).
The SPY daily candle could be a star, Doji-star like yesterday or even a bearish engulfing candle, what's important is that volume pick up above yesterday's.
The same holds exactly true for the QQQ.
And while the start to the IWM's cycle/bounce looks a bit different from SPY/QQQ, the current canoodles and volume do not.
Intraday as I said, there hasn't been whole lot of movement, the strongest divergence in the 1 min intraday chart area we have seen was the last 2 hours of Friday afternoon suggesting early price strength this week, since then we haven't had any particularly interesting 1 min charts, although others have been moving.
SPY 1 min intraday, again the strongest divergence in this timeframe was last seen at the close Friday pointing to near term price strength early this week/yesterday. There's not a lot going on here and the TICK backs that up.
The stronger timeframes have continued to deteriorate since yesterday with the 3 min chart making a new leading negative low today. This is more of the "condition" of the market which was obvious from last night's Dominant P/V relationship which was the most bearish of the 4 possibilities. The 1 min chart in this scenario will be more of a timing indication.
And the SPY 5 min chart showing the divergence and the bounce expected from last Monday as sentiment on the Fear and Greed Index was WAY too far to the fearful/bearish side, which is when we said Wall St. would flip the boat and then created second support at the SPX 150-ma leading to this run and a change in sentiment.
The 5 min chart since the last run starting at the right white hash mark is obviously deteriorating.
The Q's intraday also haven't shown much movement...
However again the stronger timeframes/trends like this 3 min chart continue to make new leading negative lows.
The 1 min IWM has a slight positive look to it, but nothing I'd trade.
Again it is no different than the SPY/QQQ when you get to the stronger charts like the 3 min for the week at a new leading negative low or...
The 5 min IWM which needs no commentary.
This is today's intraday TICK, there's no trend other than sloppy/lateral with a fairly balanced range that is dull around +750/-600
My custom TICK indicator shows the same thing, not much of a trend other than lateral.
I do think there are other indications and I'll be posting those in follow ups. The theme though so far has been correct from the "Week Ahead" with early price strength this week and the underlying trade is fading which would set up the weakness for the rest of the week that the post envisaged.
I must say I am surprised there wasn't more of a relief rally over Greece, not that it would change the underlying fundamentals that are a year+ in the making, it's just surprising and I'm wondering if the full story is actually out or not.


No comments:
Post a Comment