If we go back to the April 2nd Market forecast with AAPL as a proxy for the market simply because it had the clearest triangle which I suspected was the play the market was setting up for a head fake move, IMPORTANT: AAPL Set-up & Market Movement, this is what the SPX looked like at that point...

We were looking for a false breakout above those triangles and for that breakout to fail and the reason we already expected the breakout to be a head fake over a month before it began were the long term charts with the highest probability resolution, charts like this daily ES (SPX E-mini futures)...

The head fake concept is very strong which made it pretty easy to forecast ad we had proof that the triangles up to that point had already shown us that they were not random or naturally occurring, but engineered as the 3C divergences proved. To create a bullish looking ascending triangle, there's really only one reason and that's to get retail chasing it, but with the chart above and others, we knew how it would end before it even started.
Here's what has happened since.

We even expected a move down to the 100-day moving average in yellow and this is where I think the market is in trouble and at a very dangerous crossroads...
While I usually expect some kind of game playing around the average, maybe even a little bounce, you've seen how bad the charts look. This 100-day (yellow m.a.) has held numerous times as support, but since we have a head fake move in on the daily chart above, I suspect this time it will fail.


Interestingly, as you might recall on Friday I said you can't consider any analysis without considering the HY Credit analysis as it is key to the market, that would be this post with the HY Credit analysis, What High Yield credit is Screaming
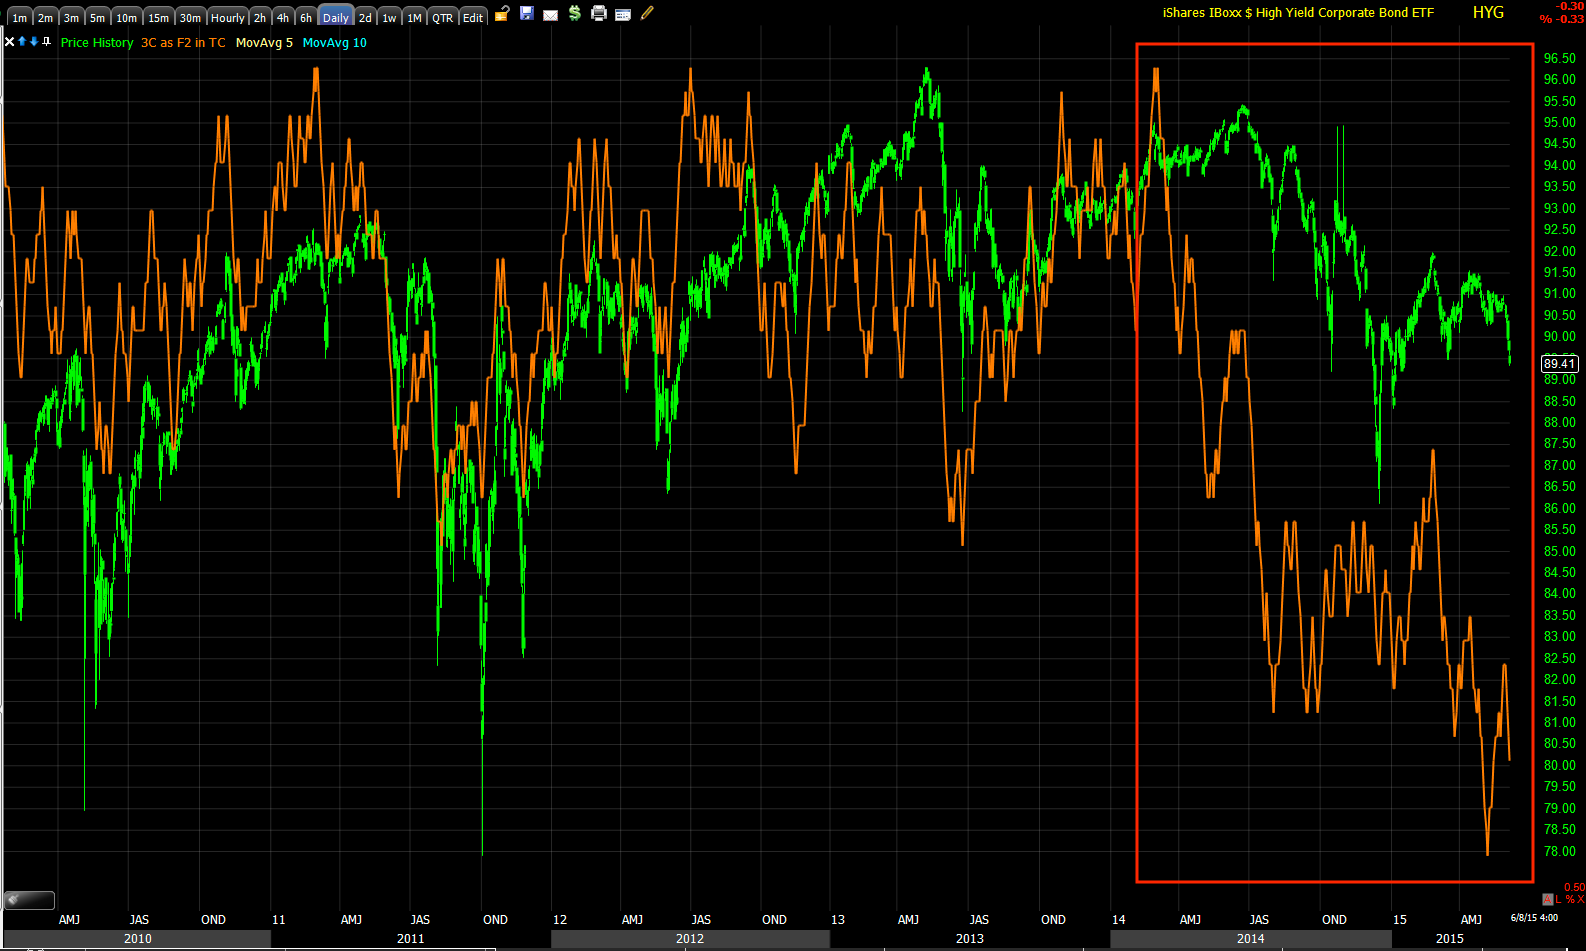
In addition, as a Leading Indicator, not only has it broken down on a big picture basis...

HY Credit has broken down on the intermediate and shorter term timing charts.
The SPX again is sitting at the 100-day...

While I hope we do get a decent bounce to add some nice positions that need it (take NFLX or Transports as I have recently posted them as trade set-ups), there's big trouble right ahead.


TICK shows it's not out of the question that the market does some of that work...

And this is still the reason why...


That may change with a nice run on stops and offer the market a brief reprieve, the thing is, it could just as well go the other way.

The point is...just don't get lost in the lines, keep the bigger picture in focus.


No comments:
Post a Comment