" leaving some room to reflect the speculative nature of the position and some room in case there's a larger reversal process."
As such, I'd consider the position an add to if there's a larger reversal process as a larger base can support a larger move.
This morning someone sold $1.4 bn in gold futures, that kind of a sale of course is going to drop gold prices, but the odd thing is this: put yourself in that position, even as smaller traders, would you dump a large position in to an illiquid market in extended hours/pre-market? I'm pretty sure you can guess what the result would be for your position's fill.
However I recall reading a story just this morning in which China, an investor who could afford to knock the price of gold lower, has been accumulating gold and just admitted it openly after not having updated their holdings since April of 2009 when they were at 33.89 mn oz. or approx. 1054 metric tons.
In a newly released update for the first time since 2009, China's holdings have vastly increased, here's the official release chart.

It's rather interesting that we get a $1.4 bn sale of gold futures this morning knocking gold down.
I've thought for a while that bigger picture, we are close to a bottom and upside reversal in gold, I've actually posted on it quite a bit the last 2 weeks or so. Apparently the Chinese accumulation of gold may be part of what we are seeing on some longer term charts in a not so direct way, but more of you see a shadow and you know there's an object there.
As for the potential adding to GLD calls on a wider base or reversal process as posted with this week's GLD post above...

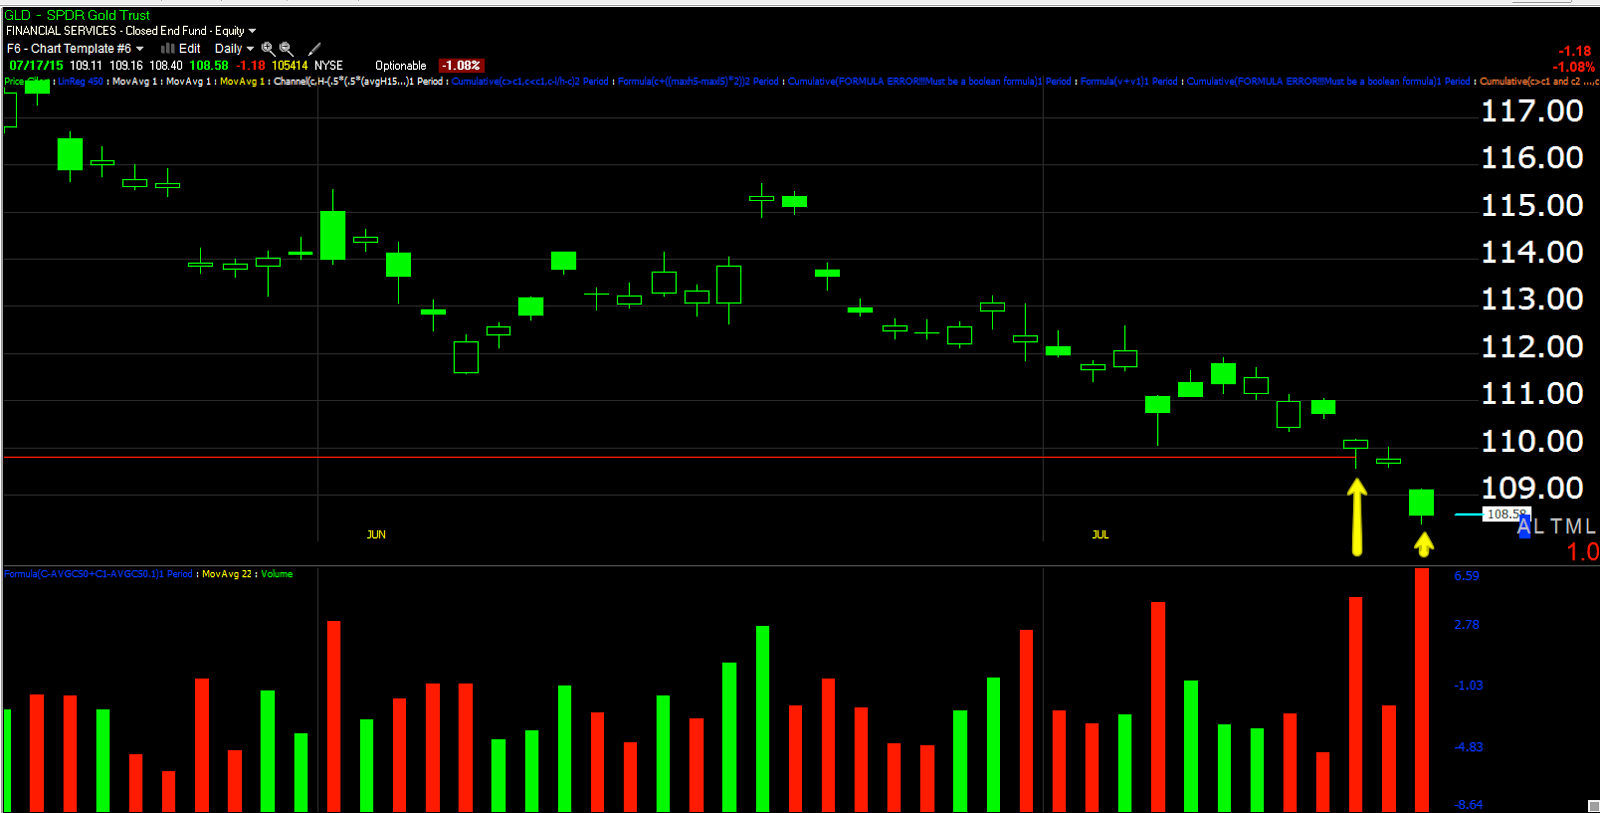
As I said earlier in the week, I wouldn't have a problem adding to GLD if it were forming a larger base, that's the reason it was considered to be a partial position in the first place as you can see above from the actual post.
However it's VERY unlikely we get a reversal on a dime without some lateral movement or reversal process and if someone is indeed interested in knocking Gold down to accumulate at lower prices, they aren't likely to finish that in a single day, but it does open up the supply needed at cheaper prices as volume above for today's daily candle shows. Despite any charts above and beyond the chart above, I think we can all agree that something seems a little fishy with a $1.4 bn sale in pre-market of gold futures as the Chinese 57% increase in gold is released. I believe it was Barcalys who was so interested recently in China's holdings as they saw a larger inventory as being supportive of gold, yet a $1.4 bn sale pops along.
In any case, this is certainly something I don't want to play "Hardy Boys" with and rather just let the charts tells us what's what which after today's intraday reset is not going to be within a few hours, but so far...


I'm not going to make a rash decision on GLD right now. I would like to see something like a bullish Hammer on the closing candle today and maybe we get that, maybe we don't, it's not crucial to the bigger picture, but would potentially be helpful to the near term and deciding whether or not we have enough of a reversal process to make adding here worthwhile , in fact to make adding at all worthwhile. So far so good, but again, it's a big mover, a big number and it's not going to resolve in a few hours.
I'll continue to update as new data becomes available or the position becomes actionable. Right now I'd expect it to move more laterally and get itself in order after this morning's move.


No comments:
Post a Comment