I still want to do my daily run through the futures which tells me a lot about trends that are developing such as the $USD/JPY trend that's losing strength, the same carry pair that has been near tick for tick during this entire bounce through this week.
As I pointed out in the last post, a declining USD/JPY may have implications for the board market and it lacking the support that has been behind it all week, but specifically the $?USD declining has implications on $USD denominated assets such as oil.
There's no perfect correlation between the two in legacy arbitrage terms because we have too much noise like the Iran nuclear deal which means embargoes will "EVENTUALLY" be lifted, but the market always seems to have an immediate knee jerk to something that's not really relevant from months or even a year.
The bottom line is that you can see, although not with perfection, the legacy arbitrage correlation between the $USD and the $USD denominated asset, oil.
This is the 2 hour chart comparing the $USDX (US Dollar Index) in candlesticks to Brent Crude oil futures in purple.
It's not a perfect mirror opposite inverse correlation, but you can grasp the general concept.
Here's a closer view of the same two assets on a 5 min chart
I still will be running through futures just as I do every day, but the last 3 days we have been seeing increasing probabilities of the market sponsoring carry pair USD/JPY starting to show stronger and stronger signs that it's going to make a move lower which means the $USD will move lower. While that specifically has a direct effect on the market, it's the $USD moving lower that has a more direct impact on oil futures/oil.
This is the $USDX 5 min chart's negative 3C divergence.
The $USD's 15 min chart with a positive divergence coming in to this week's bounce and a failing negative divergence currently which is part of the USD/JPY signal more broadly speaking, but since we are looking specifically at oil, a decline in the $USD has a high probability of sending oil higher.
$USDX 30 min negative
Oil futures...
/Cl (Brent Curde futures) 1 min intraday showing the same intraday positive activity as USO.
CL/ 7 min with a positive divergence in to today's lows.
And the broader CL 30 min chart with a leading positive divergence in the area, which makes me look at this as a larger base rather than a short er gap fill bounce.
The CL 60 min chart just reinforces that perspective.
USO charts...
USO's 1 min intraday chart has turned positive and since pulled back on a small negative divergence.
USO's 2 min chart'd trend view, again it makes me look at this as more of a larger base area than just a bounce. The break below support would be right in line with a head fake move just as we have talked about this week for the broad market, just in reverse with a stop run rather than a false breakout, which is what it looks like we are dealing with to the far right.
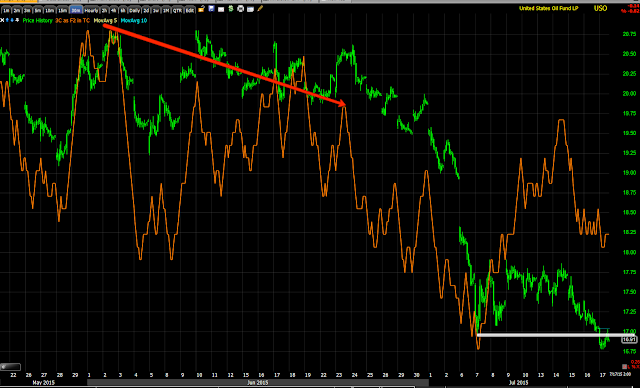
USO 5 min with a leading positive divergence today.
And the larger view, like the 30 and 60 min Crude futures, the USO 30 min chart is leading positive at what would be a head fake move on a second low of a double base or a "W" base.
and the same thing on the 60 min chart.
To me it looks like longer term, although not primary trend. charts are developing and the USO position, Trade Idea: USO SPECULATIVE (Long) Bounce which is August monthly expiration, may in fact be worth adding to.
We have probabilities setting up nicely here, now I'd like to wait for extremely strong charts that are unambiguous, beyond simple probabilities , the kind of charts that jump off the screen. If I see those kind of signals, I'll be adding to USO. I put the probabilities of that fairly high, but I don't want to get caught up in this need for immediacy, I want to have the strongest possible position I can expect before adding to the position , even though I think it's a high probability add to, I want to be able to look at the charts and know that this is the strongest probability I can reasonable expect- the kind I don't ignore.
We may see that before the end of the day, we may see that next week. There a chance that the charts are exactly correct and we miss the add-to position, but I'd much rather miss the trade than gamble on probabilities. Over hundreds of trades and years of experience, I think in the end, you'll be much happier to have relied on the strongest probabilities rather than to speculate on strong looking charts.
Is interest rates about to start going up?
-
Yes, I know - it does not make any sense - FED is about to cut
rates...but....real world interest rates are not always what FED wants it
to be.
6 years ago


No comments:
Post a Comment