Or rather SRTY. It seems I made a typo in the last market update post and typed "Blog off top' regarding the QQQ, that should have said, "Blow-off top".
In any case, here's the IWM, why I chose a partial position at this point (3 years ago I would have absolutely gone all in, I've learned to be a bit more patient since then and a bit more careful-probably too careful in some instances, but over the period of many years and many trades I'd rather be a little too careful and have the best signals than too enthusiastic on what I believe in before I actually have the objective evidence that operates us from gamblers going on a hunch, even an educated hunch).
IWM 2 min with yesterday's intraday negative sending it lower causing me a brief moment of panic before telling myself that all of the probabilities point to a wider reversal process and the highest probability is a head fake move around 80% before a reversal, usually right before a reversal. Then additional charts with divergences like the late day positive (white) started showing up and patience was well founded.
The 2 min chart is leading negative deeper today than yesterday and this is important on a 2min chart which is far from the strongest timeframe because of timing, at this stage these intraday charts make for excellent timing signals. Note the price difference between point A and point B and note the 3C difference between point A and B, that is the essence of a divergence and exactly what I want to see in a suspected head fake move because it's only a head fake move if you can show objective evidence that it is most likely to fail, then it becomes a very valuable positioning point in the cycle.
This is the 1 min intraday chart, it's overall negative and there's not much to see, the only thing to see is the far right with a potential intraday positive divergence which could send the IWM back toward its morning range. If the other charts and/or this chart keep leading negative and worsening in to an intraday move back toward the a.m. highs in IWM, we then have the basis for a sweet options entry. Not that it couldn't be done here and now, but if you're going to try to thread the needle, might as well do it right.
The 5 min IWM chart is just on the border of making a new leading low which is important because of the concept of migration and the 10 min chart that I pointed out earlier in my first IWM update, IWM UPDATE
In fact since capturing these charts, the IWM is seeing some additional upside as the intraday 1 min chart was very close to pointing out at the time of capture and the 5 min chart above is now leading at a new low below the red trendily so the hopes that I had or was beginning to explain above are already in play right now.
As I was explaining, the importance of the 5 min chart deteriorating is that the divergence is strengthening and in this morning's first IWM update, I said I'd like to see the 10 min chart make a new leading negative low. At the time I captured the 10 min chart for the post this morning, the IWM 10 min was right at the small red hash mark and I drew in a blue arrow showing where I'd like to see it move. Thus far it has moved lower as expected and hoped for and the target I set was a new leading negative low below the yellow trendily.
Since capturing this chart just 5+ mins ago, it too is lower than what you see above and just off the yellow line which I anticipate it will break beneath, if it can do this with the IWM still holding up price, the options/put position entry looks exceptionally good which is part of the reason (leaving options open-no pun intended), for the partial SRTY position.
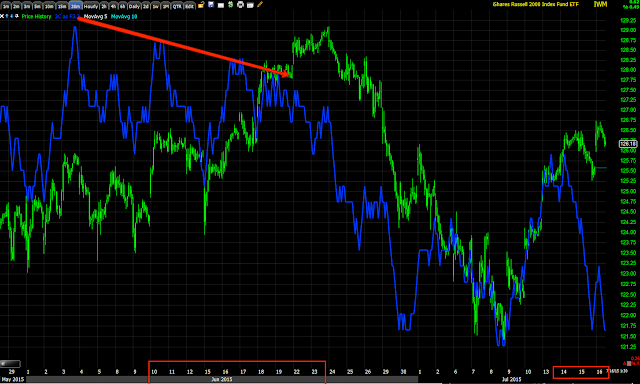
The real dirty chart is this 30 min chart, it reduces noise as small moves don't show up here, they aren't strong enough to, but the larger underlying trend is cleaned up and is much more clear.
This is officially a VERY ugly chart, I really can't see this not being an excellent short so it's really all about timing right now and which tools are deployed (options, ETFs, leveraged ETFs, etc.)
The same thing is seen here on the Russell 2000 futures 15 min chart with the small base from a week or so ago with an in line trend on stage 2 mark up of this bounce cycle and a pretty clear divergence at the stage 3 top of this cycle.
So far so good, patience does pay, it's nerve racking sometimes, but if its based on objective evidence and strong concepts, it usually wins out.
Is interest rates about to start going up?
-
Yes, I know - it does not make any sense - FED is about to cut
rates...but....real world interest rates are not always what FED wants it
to be.
6 years ago


No comments:
Post a Comment