First looking to Greece after a flurry of headlines over the weekend, a split between the EU and the IMF, the country's political choice to end austerity with a party that ends up putting out a referendum, ignoring the results and coming back with a worse deal than before Syria had been elected.
Greek banks, despite some late last week news otherwise, did open today with a cash withdrawl limit of $60 Euros ($65 $USD) per day or as of Sunday, a weekly total 4420 Euros ($455) with no check cashing allowed, although check deposits are of course fine. If I had to pay my health insurance with those kind of rules, I wouldn't have health insurance.
The Value Added Taxes (VAT) are in effect after having passed Greek parliament which for a country that has massive problems collecting income taxes, may have just created the most confusing tax code ever. The VAT taxes went from 13% to 23% as per Germany's, a-hem, I mean the Troika's demands. These effect some 40,000 food items, taxis, hotels, and much more, but to make it incredibly confusing for a people who can only take out $60 Euros a day, if you ordered a skewer of pork the VAT would still be at 13%, but if you ordered the same skewer of pork with tomatoes and peppers, then the VAT rate would be 23% even though vegetables are still taxed at the 13% rate. That's just one example of how absurd and confusing this new VAT tax is.
As for the bridge loan to get Greece through until a proper and formal deal gets done, a bridge loan of $7.1 bn euros was made, but just as soon as the money was sent to Greece it had to be sent back to the ECB and IMF with back payments of $6.8 bn Euros due leaving Greece $300 mn Euros as the new bridge loan to get them by until a formal deal is negotiated. Just as a reminder, in exactly 30 days Greece has a $3.2 bn Euro payment to the ECB so they better hope that deal gets done quickly.
As for the European Commission and the IMF's hard stance that Greece will not be viable without significant debt write downs, Merkel made it very clear today that this is not and will not be on the table. Other measures such as lower interest rates "may" be discussed at negotiations, but not until Greece successfully passes the first assessment of new laws enacted, then they "may" be considered so once again like the previous 2 bailouts which we said at the time were nothing more than kicking the can as we see by the need for a 3rd bailout, everyone who has any credibility like the IMF who is also owed money, is telling us this is nothing more than extend and pretend, but for now it allows the creditors to pay themselves back through Greece interestingly as Germany now has total control over the Greek parliament.
So Greece is saved, lets rally?

As posted earlier today, NASDAQ breadth...

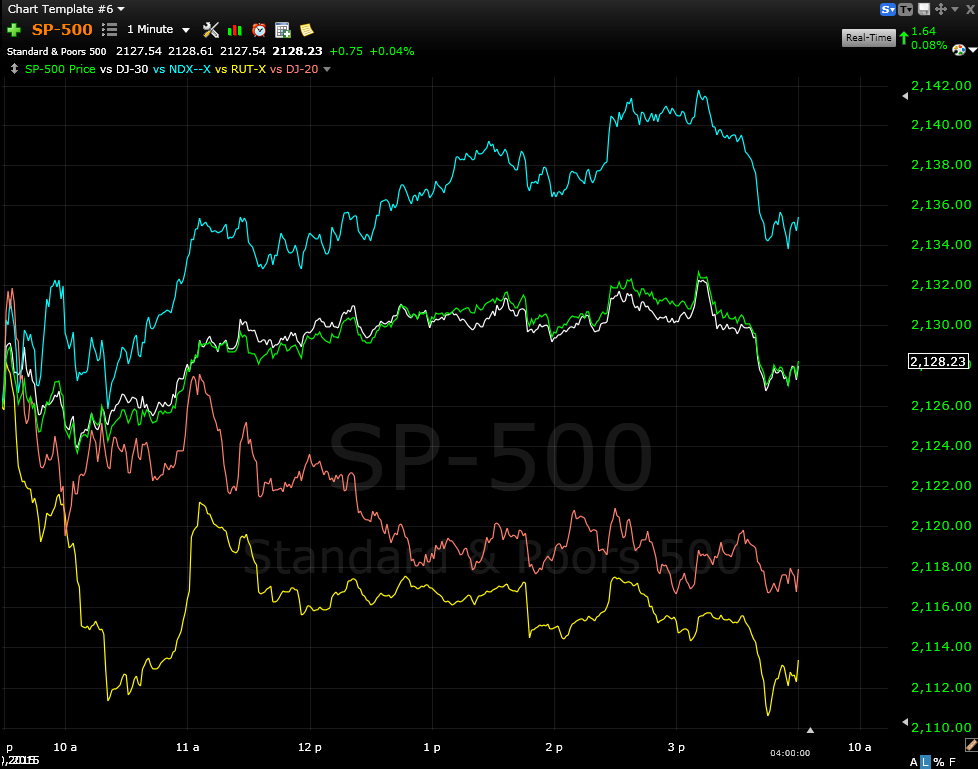
And the S&P vs an equal weighted Index...

And on the day...
As the Friday post, The Week Ahead said,
"As for Index futures, it looks to me they need about a half a day to finish up, although that's a pretty specific prediction, but the charts are clearly negative."
Today you got a taste of the continuing deterioration in Index futures as well as the motor behind the bounce (or one of them at least), the USD/JPY carry trade (see FX-Market Correlation / Divergence and Index Futures from earlier today).
It was absolutely surreal considering the Week Ahead forecast that James (The Whip) Bullard of the St. Louis F_E_D was out with hawkish talk as I showed you earlier what happened last tome he said exactly what was needed to send the market in the exact direction we had forecasted days and even more than a week before hand, When Jim Bullard Talks, Markets Listen.
The one update I didn't get to today was Leading Indicators, you can compare them today to Friday's LEADING INDICATORS ALL UGLY post.
Remember, in a healthy market these indicators should be in line with the SPX or leading it, not negatively dislocated from it.


Leading Indicators are ugly across the board. Index Futures are ugly, the component currencies in the Carry Trade pairs are ugly, the 3C charts are ugly and the concept of a head fake is firmly in place and we get the bonus of Bullard today.
You saw the 5 min timing charts for Index futures earlier today. The only one that's not quite there (although all of them could look worse and may in the morning) was the Russell 2000 futures and the reason I said what I said in the excerpt above from the The Week Ahead post. I probably would have added to SRTY and or IWM puts "if" we had seen a move in to the green that was worthy and reduced risk and/or gave us a discount on put positions. As it stands, I didn't make any changes there, but I hope to which would mean we'd still need the IWM to make a bounce from here as it has been the relative under-performer.
I showed you earlier today how the IWM could still bounce from here and I believe it still can (that doesn't mean the rest of the market would act in similar fashion as the IWM and Transports have been dislocated from the rest of the market)...


As to USO, there were some improving charts in USO today, not as much in oil futures so I figured I'd give it another day and update USO tomorrow. As for Gold, something strange is amiss.
As noted earlier today in the A.M. Update, Gold was slammed again in another illiquid market last night around the time China opened, some $2.7 bn notional in gold sold which halted gold twice for 20 seconds with exactly 30 seconds between halts as NANEX shows from overnight...

This took out the entire bis/ask stack , of course in a very illiquid market and sent gold below the psychological $1100 level, but it seems someone is trying to break the multi-decade trendily at $1080 to clear all stops for whatever reason and just after the close today they tried again.

As NANEX notes, the selling is NEVER in to any buying so someone is CLEARLY trying to knock gold lower, but we knew that last week just by the transaction and time in an illiquid market.

So there's some reason someone is purposefully trying to get the worst fill possible and it looks like to run all the stops out of town. Remember price is deceiving so we don't REALLY know who or why, although I'm sure COMEX is looking at this very closely as it is clearly a disruptive market practice.
I'll be watching gold very carefully and see if maybe this is for a reason that would not first seem apparent, but really, why would you sell in to no demand at the least liquid time of the day if you weren't trying to clear all stops?
All of the averages except the R2K closed out with a bearish reversal Star/Doji star, I'd prefer to see it on volume, although not necessary, it does make the reversal candle about 3-4 times more effective.
I'll also be busy tomorrow updating various assets including some core shorts that look decent for an add-to that are nicely in the green and numerous other assets including a couple of the Four Horsemen of Tech (Cramer)!
And with that, we'll leave off for the moment unless futures start making some unusual moves, otherwise it looks like we are on track and I believe the next leg lower will slice through the 200-day just as the last bounce off the 150-ma sliced through it, but that has been my opinion since April long before any of this happened.
Have a great night!


No comments:
Post a Comment