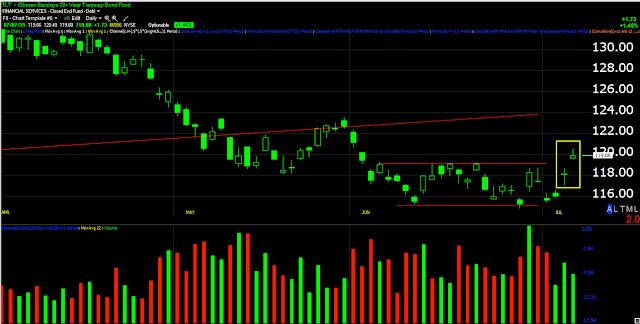
I've been in this TBT short position (essentially a 2x long TLT position) for a while now. I still like the TLT trade...
The larger picture 30 min chart still looks great.
However looking at this daily chart, the last 2 daily candles look pretty darn weak here and on gaps.
I've been watching some weakness developing in intermediate charts in the near term like this 10 min
This 5 min shows it even more sharply.
As does this 3 min.
But when we get to the 1 min timing charts, that's about as far as I want to go and you can see the divergence today.
In the end I exited the TBT short at just about breakeven so I'm still liking the trade, just after a pullback and some near term chart work improves.
Is interest rates about to start going up?
-
Yes, I know - it does not make any sense - FED is about to cut
rates...but....real world interest rates are not always what FED wants it
to be.
6 years ago


No comments:
Post a Comment