Monday, November 7, 2011

Energy Sector

Beyond Crude, the Energy Sector provided early support to the market, lets take a look at what's going on there via XLE.

 XLE 60 min shows the October rally hitting a top (island top) and the flag bounce since has turned down on a negative divergence. This is the longer term trend.

 The 30 min chart shows much the same, with the recent flag starting to unravel.

 The 15 min chart shows today's early strength was on a negative divergence and XLE has headed lower since the open.

 The 10 min chart just confirms this in more detail.

 The 5 min chart showing the divergence at the top as well as the flag falling apart, you can see there is no longer a diagonal channel, but rather it is rolling over.

And the 1 min chart, (intraday timeframe) shows the possibility of an intraday bounce. The weight of all the charts combined has a vert bearish slant.


Can We Get an Update Ema?

We have a member smack dab right in the middle, or rather the northern end of Italy. The US news is horrible as far as covering anything abroad, if you have ever travelled abroad, you would agree that European news overage of world events is much better then US coverage. We pretty much only cover countries no one in the US has heard of when we are dropping bombs from predator drones.

In any case, Ema, out Italian member has a good grasp on Italian politics which are fluid to say the least today.

As I posted this weekend, the ECB has made a lot of noise this weekend about halting purchases of Italian 10 years or any bonds if the country they are buying to support isn't dong their part. I think Silvio falling asleep several times at the G20 summit while Italy was under discussion may have been part of the catalyst for the weekend statement. However as I continue to point out, the PIIGS know they hold the trump card as the EFSF can't even raise $3 billion is bond purchases, much less a trillion! The EFSF was crafted mainly for Greece (whether they really want it or not, who knows), it doesn't have the size (even if the imaginary box is filled with $1 Trillion Euros) to do anything should Italy's borrowing costs look them out of the market, so no matter what Draghi says, Silvio knows if they let Italy fall, the entire EU falls.

From ECB warnings of no more purchases to 5 interventions today...


Here we have 5 ECB interventions in the Italian 10 year, yet the bond is now trading below all of the interventions making the ECB investment sort of worthless.

There's good evidence to suggest when the 6% threshold is broken and debt becomes "unsustainable" that it accelerates from there, just as Greece, Portugal and Ireland did. This means that focus is squarely off Greece in the bond market and squarely on Italy and Italy doesn't have much time and the EU doesn't have much time to get this under control. If Italy falls, as the 3rd largest EU economy, so goes Europe. Bonds aren't very interesting for equity traders, but this is a stark warning of things unravelling at an accelerating pace; which does have implications for equities.

Italian 10 years are now at 6.66% and the November 10th auction has been cancelled for obvious reasons.

So Ema, if you have any update as to what is going on politically or have access to Silvio's Facebook account, let us know. Something is certainly stirring the Italian bond market today, despite 5 ECB interventions.

USO Update

This is a chart of an inverse ETF or short on crude oil, SCO. Last Friday I updated USO/SCO in this post and the last thing I said about the chart above was this,

"The only other thing, aside from what I said at the start, is there's an obvious support line, a lot of the time a good move will start with a head fake, like a move below support and then flying higher."


Which being an inverse ETF, would mean USO would have to break higher out of it's range based trade.


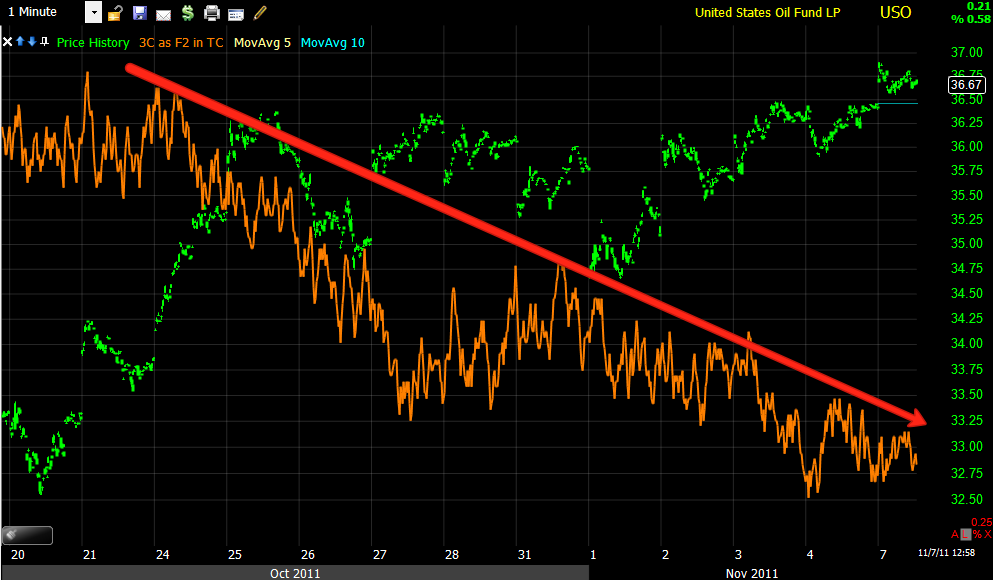
 USO vs FXE should be a nearly identical correlation, it has clearly broke the correlation and run up ahead of the stronger dollar. This is one of the strongest correlations in the market.

 A 15 min chart shows a closer view

Here is SCO breaking below the consolidation/base I mentioned on Friday.


 This is USO's wedge like trade, this would be considered a bearish wedge.

 The hourly chart is still very ugly for USO

 As is the 30 min

 And the 15 min

 As well as the 2 min and 1 min below showing no confirmation for this move.

1 min.


So the correlation to the dollar, which crude is priced in the world over is shattered, the 3C harts long and short look very bad for USO, the potential "false break talked about on Friday has occurred", if it were not for 1 thing, I would call this one of the best short set ups in the market. That one thing is the IAEA inspectors report on Iran's nuclear progress. 


The bottom line, probabilities of an Israeli attack on the facilities has gone up and is expected around late November/December. This could be what is pushing on the broken correlation, but the real question is whether USO will be dumped to be accumulated before late November or not. The 3C charts suggest it will. I personally would try to wait and be patient and look for signs of today being a false breakout with USO moving down below the $36.50 level, the harder it falls and the higher the volume, the more likely this is a false breakout setting up a fall and potential accumulation before the end of November.


Crude usually isn't that hard to trade, the exception is when Israel gets involved in the picture especially as it relates to Iran.


Again, I would encourage patience as you may very well end up with an excellent trade here.


Is Barclays in the crosshairs?

Sovereign debt exposure to PIIGS, exactly what brought down MF Global and caused Jefferies to have it's trade interrupted several times last week as circuit breakers kicked in as it lost over 20% in a day, and caused Jefferies to release their exposure last Friday saying it was not a problem, yet they still sold half of it over the weekend, is showing a new trend in the scrutinization of bank holdings-all of this which was not revealed as we know from Austria's mega bank ERSTE during the last 2 stress tests as they found accounting gimmicks to hide the exposure.

Well it seems Barclays is holding on to a little more then the market would like and this new development should be interesting over the next week or perhaps less.

BCS is holding $12.5 BB in sovereign via Bloomberg, over $20 billion risk to corporations which are in much worse shape in the EU then in the US, and another 10.2 bb in financial institutions which may as well be sovereign risk as no one knows what counter party risk any bank is holding due to the ineffective and useless European Bank Stress tests. There's another $66 bb in retail exposure, but the kicker there is 86% of that is in Spain and Italy.

BCS hasn't looked very good over the last several years, completely missing the 2009 rally and if they become the target of bank runs, rumors and bear raids, they may find that they are in the same quick sinking boat as MF Global and THIS is EXACTLY why I say this time is so reminiscent of the Lehman Era when liquidity absolutely froze as well as the credit markets because no one bank knew what counter party risk the other transacting bank was holding, it's nearly a spitting image except rather then subprime assets being the hot potato, know it is sovereign exposures of almost any type.

We'll use this post as a baseline of BCS and measure what happens over the next week or two to determine how out of control this situation may be getting.

 BCS weekly chart shows a dramatic decline during the 2007/2008 period and at the 2009 bottom, instead of rallying like everything else did, it simply travelled laterally and recently broke below support of 3 years. Volume looks a lot like a rounding top.

 Here's the current situation, not only is that hanging man with huge volume a bad sign as it indicates massive churning on the day in the white box, but today' loss is nearly a full percentage point higher then the implied Beta vs the S&P.

 The long term 3C charts are hard to fool, no manipulation of any length can through them off, so this 6 day hart shows confirmation at the green arrows and what a very small negative divergence in 2007 led to, the current negative divergence is much worse.

 Here's the hourly chart again with good confirmation of the downtrend, but the October rally failed to lift 3C much at all and remains negatively divergence and leading as well.


The 15 min chart also shows confirmation of the downtrend and a very weak showing on the October rally.

This is out baseline, lets see what happens this week and how much focus or how much of a spotlight is cast on Barclays. This information may be valuable for a trade, but more valuable in telling us where we are as far as a possible black swan event.

Treasury Confirmation

Treasuries trade inversely to the market, when the market falls there is a flight to safety trade in to treasuries, so treasuries should look roughly like the mirror opposite of the market.

 Just as the market shows us bear flags, treasuries (via TLT 20+ year) shows us a bull flag, formed well with correct volume in to the flag. Also at a breakout point as market bear flags are at a breakdown point.

 The 1 min TLT is showing a negative divergence intraday as the market shows intraday positive divergences so this is pretty good confirmation.

 However the TLT 2 min chart looks much stronger then most market negative divergences.

As does the 10 min chart, all of this still suggesting an intraday bounce as the longer term trends like the 10 min chart remain very bullish for treasuries and thus bearish for the market.

Intraday bounce

 DIA 1 min

 DIA 2 min shows some signs of a positive divergence

 QQQ 1 min has a leading positive

 As does the 2 min, the Q's look the strongest.

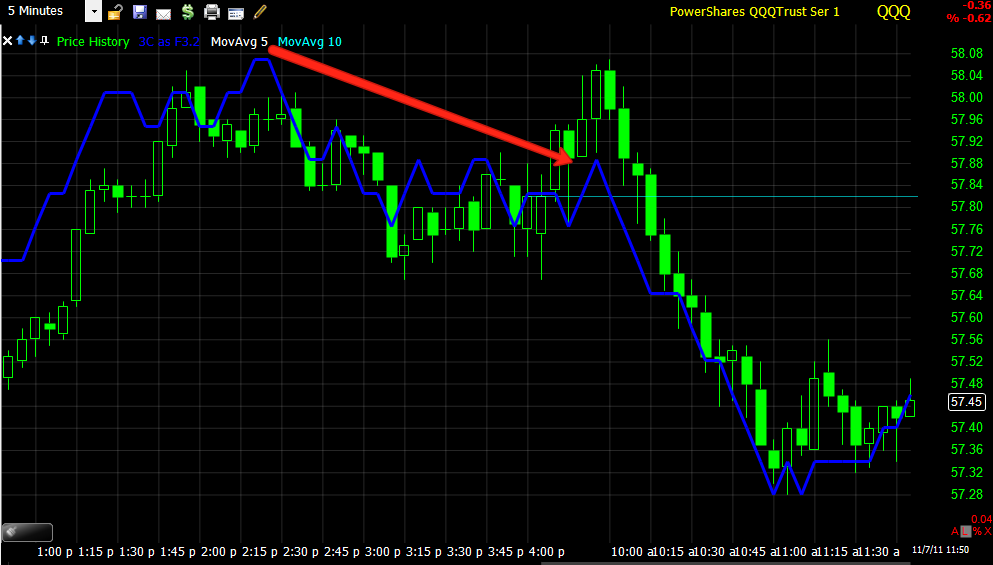
 QQQ 5 min is in line, no divergence

 SPY 1 min positive divergence

SPY 2 min is inline looking the worst of the 3.

The sooner the move starts, the smaller it will be, if it keeps accumulating the larger it will be. Still it's only on intraday timeframes.

All the flags

Bear flags are consolidation/continuation patterns, they trend up in a flag like consolidation and then break to new lows continuing the downtrend that preceded them. They are also highly visible on a chart and are almost always manipulated in the short term. According to technical analysis, a bear flag (when it breaks out of the flag) should break downwards, however Wall Street knows that is what technical traders are betting and trading on so they almost always break the flag out to the upside first, which shakes out the shorts that entered short because of the bearish pattern, then to add insult to injury, technical analysis teaches that if a pattern fails, you should reverse your trade and thus go long the failed flag, of course that's about the time that Wall Street lets the flag break down as it was supposed to do the whole time. This is the typical day in and day out manipulation of technical traders that has been going on for over a decade. I do remember when these patterns worked as they were supposed to, but back then technical analysis wasn't very popular either. In any case, the bigger the technical pattern, the more likely it will be manipulated, but also the more likely it will do as it was supposed to do in the first place at some point. Watching for the false breaks can often give you an edge and better positioning on your trade.

 Here is the DIA's flag, different then the SPY, but a flag.  This is as clean of a flag as you will probably see, it has broken below the flag and as normal, tested the lower channel (resistance). There was no significant volume on the DIA break of the flag. The Dow-30 showed a little more volume, but that was on the way to breaking down, not quite on the break.

 Here's 3C during the DIA flag, showing a negative divergence sending price from the top channel to a break down below. On the Dow-30 it is this divergence and move down where the larger volume is found. You can also see a negative divergence on the test of resistance (the lower flag trendline) suggesting that too will fail.


 Here's the QQQ's flag which is manipulated not once, but 3 times, maybe 4, You can see volume pick up as the longs sell when prices re-enter the flag at least 2 times.

 Here's the 15 min QQQ 3C chart for the flag, negative at the first major break, again like the DIA's divergence, volume picked up here and the second negative divergence leading to a negative leading divergence, volume picked up here as well. Why do they do this? Because the earn money on the bid /ask spread by creating events that traders will buy or sell, anytime volume increase, so does their pay day via the bid/ask spread and volume rebates-the more volume they send to their clearing house, the more of a kickback they get in the way of volume rebates.

 Here's the QQQ 5 min showing the last divergence from late Friday and leading negative today, the QQQ should find temporary support at the bottom of the flag and should break below the flag, I would guess with the activity already in the Q's, volume will increase.

Here's the SPY double flag I showed earlier, which I showed the divergences as well, not much of an uptick in volume, but it was there.

The environment right now is technically deteriorating.

Flag of a Flag

 Here's the area of focus, the top area from the October rally, which formed a failed bear flag, which formed another small flag below it.

 This is a closer view of the region.

 Here's the 5 min 3C chart, negative at the top of the rally, negative at the top of the first flag and leading negative at the second smaller flag.

 Here's the 2 min chart of the negative divergences at the larger and smaller flag.

And today's 1 min chart of the smaller flag.

ES Trade

It looks like overnight low volume accumulation in ES with a negative divergence coming in to play just as the higher volume regular market hours begin.

ANOTHER VOLATILE DAY AND WEEK AHEAD

Maybe we should just call it another month or quarter. What initially seemed like bullish news with G-Pap agreeing to step down in exchange for a unity government in Greece was quickly glossed over and attention focussed squarely on Italy this weekend with the market wanting to see Berlsculoni step down, why?

Here is Berlsculoni at the G-20 summit
Other then the beautiful blue background, the other thing of note is he is sleeping and had to be awaken several times just as Italy was being discussed. Furthermore he refuted rumors of his stepping aside this morning via no other news source then his TWITTER account! Obviously from the ECB's communique this weekend, most feel he is not up to the task and whether he steps down or is forced out will create a lot of volatility in the markets this week. Italian 10 year note yields were hitting all time highs this morning of 6.6%, close to the levels that brought down other PIIGS. Despite Draghi's weekend warning to stop buying Italian bonds if the government in effect, "won't help itself", apparently since stepping in to the role of head of the ECB, he has doubled purchases of Italian bonds, yet they still are hitting all time high, making Europe's 3rd largest economy the domino that could pull the entire house down.

Jefferies which has released their European sovereign debt holdings several times over the last week to show there are no problems and they are not the next MF Global, somehow managed to dump nearly 50% of them since the close on Friday, this really has the feel of the 2008 era when banks said they had no more subprime exposure, just to write it down again over the next 4 quarters or until they were taken over by the government.

As for volatility in the commodities space, the MF global accounts that have been transferred to smaller to midsize brokers have been transferred with ZERO capital allocation, it appears only CME got money, so if you were a MF Global customer, you got a margin call today for the full amount, if it is not met by the EOD today, accounts are liquidated, while all CME customers enjoy a 30% discount on margins across the board on any new positions, it's like a tug of war and should lead to, well who really knows what. It's odd that the smaller brokers with less resources to issue margin calls and liquidate accounts got zilch in margin money from the MF Global trust, but I guess it's good to be the king or CME.

So it looks to be another week in which trade is dominated by rumors, rebuttals and confidence votes.

Yet as the Wall Street Journal pointed out today, Merkozy made a huge mistake in saying at the G-20 that any country is free to leave. That puts unlimited risk on Euro bonds and likely will do nothing to attract investors in to the EFSF fund, which even the Germans will not pledge their gold as collateral. 6 weeks ago they said they would do anything to save the Euro, now, not so much.

Volatility may abound, but the end of the story seems pretty clear.