Thursday, April 26, 2012

Quick market update

There are some signs that the parabolic intraday move is running in to headwinds again, I'll need to look further to figure out what they are.

For the time being, a pullback/consolidation looks probable.
 1 min SPY

2 min SPY leading negative intraday. That is really a parabolic move, even though it is small/intraday.

GDXJ Update

 Nearly a 35% gain in GDXJ


 Having broken out of the consolidation, volume has dropped off, RSI has a slight negative divergence, it just looks likely it will pullback.

 GDX looks a bit better near term than GDXJ in 3C, but GDXJ has clearly been the better choice. Here's  1 min negative divergence, not horrible, but enough to justify the probability of a pullback.

 The 2 min is lagging.

The 60 min still looks great and if I get the pullback I would look at a longer dated expiration considering this longer positive divergence on a 60 min chart.

Closing GDXJ

Here's my rationale, I still like GDXJ for further gains, the position is at a 35% gain, but I feel a pullback could come in to play, even a 1 day pullback could do some damage and I would rather re-enter the trade with a longer expiration.

SPX 1400

I believe it was yesterday when I was talking about April 10th when the SPX broke the 50-ay moving average. Because of the market's behavior and the predictability of that behavior, before we even had our first sign of a positive divergence , expectations were laid out of a bounce off those lows and what the bounce would do and why. The bottom line  could b paraphrased as, 'There's no point to run a bounce/volatility shakeout if it does not knock shorts out and get longs in the market, setting them up in a bull trap. To do this, serious levels of resistance would need to be taken out". I believe it was yesterday I said I thought the SPX still had enough in the tank to take out $1400 and that's a key level psychologically which helps a lot in achieving the goal of running the volatility shakeout cycle. Add to that increasing volatility and the swings become much bigger.

The SPX has done it, taken out $1400 and thus far although it is starting to get a little scary with the parabolic moves, the underlying conditions are thus far holding fairly well although that may change VERY fast.


 Not only has major resistance been taken out as well as that recent consolidation area in early April, but the centennial mark of $1400 has been hit.

The moves, especially today's even though it is not as large, it has happened very quickly, are getting very parabolic, this is caused by the increased volatility and the market doing what it set out to do, flip-flop emotions-get the shorts very scared and the bulls very excited.


AAPL Update

Patience may pay off if you are looking to initiate short in AAPL or like me, an add to.

Being we expected AAPL to be the final word on the market and being there are still several target zones that we'd like to see, but still haven't quite made it to yet, this update I think is very interesting.

 AAPL hasn't done much today, most likely consolidating yesterday's gains. The market can consolidate in two ways, through a pullback (price) or through time (price patterns like triangles, rectangles, etc). I like the looks of AAPL's volume as far as the short position goes.

 Talk about some intervention on behalf of the market ! A very nice leading positive 1 min.

 When the chart is correctly scaled, you can see the extent of the leading positive move today. One other thing that I started pointing out last night, the accumulation zones. In this case AAPL's first accumulation area as around $565-$572, AAPL dropped further from there to the $550's area. This just goes to show, Wall Street is not taking a loss on their planned cycles, even accumulating at a higher area (because AAPL is so large it takes more time and they will do it in to price weakness), AAPL is significantly higher and in a day.

This is just a point I'm trying to make with regard to some other positions or future positions.


 2 min leading positive

 Just for confirmation I took a look at the 3 min which I rarely use, again leading positive.

The 15 min was the basis of the view that Tech would take over, this formed before AAPL reported. There;s even a bit of a leading component here on the 15 min, so I think the chance to initiate a position or ad to one at higher prices not only in AAPL, but in many of the stocks we are looking at (because of AAPL) looks a lot better than it did earlier today.


Big Blue Still moving

Yesterday I put out some target areas for IBM, so far so good.

 IBM has made it through the major resistance zone at the bottom, it's now taking on the second zone at the higher red trendline, I think it can still make it to the small gap at the yellow area. If IBM's Beta wasn't so low at 0.61, I would consider starting a position here. Given the beta is low I personally would only take the trade at the yellow zone or better as a concession for the low Beta.

I pointed out last night that IBM tends to go negative in to what almost looks like a dog's tail (see the red boxes) and 3C is deteriorating on the 15 min chart, it is not as bad yet as previous divergences sending IBM lower. The price move itself since the 23rd is more volatile and parabolic than the past moves and longer lived, this makes perfect sense as market volatility has increased, so again, for the trade to be worthwhile for me, I'd want the concession of a higher price entry which also gives you a lower risk profile.


Market Update

In a previous update (I believe of Tech and PCLN), I mentioned the holding pattern the market was in with some looking better than others and mentioned that it might take an extra kick from Wall Street to get the market moving again, it looks like that extra kick came. The difficulty now is that the averages are approaching or in resistance areas and the $USD did NOT weaken, in fact the market is moving against a stable $USD, which looks like further evidence that Wall Street did actually chip in the ante needed to break the holding patterns.


 The DIA is a unique case, other than the Russell 2000, the Dow has the strongest price performance, which also means it is in the best position for selling in to strength and it appears that is underway. Here's a fairly bullish ascending triangle-as I said, some consolidations looked better than others. My concern here is this pattern is VERY obvious, the Dollar is not supportive and we are running in to resistance areas. This is not the strong environment that would produce a more stable trend.

 DIA 1 min saw a negative divergence right on the open and has been in a leading negative position since. This is only a 1 min chart, but it seems to be a clear signal that strength is being sold as it should.

 The 2 min chart here is looking pretty negative.

 The 5 min chart, while moving in the same direction, is lagging pretty badly here, this puts this chart in a leading negative position as well. I also don't like this parabolic price movement, again, the underlying conditions in the market are not stable, parabolic price moves are inherently unstable.

 The 15 min chart which is where we should see the final signals is moving in the right direction like the 5 min, but from previous bounces and the distribution in to them, the DIA as well as the rest of the market, started this bounce from a weaker position (in underlying trade) than any of the previous bounces. In fact each bounce has steadily deteriorated the underlying trend in the market.

 The QQQ was the weakest consolidation.

 Unlike the DIA which was already performing well price wise, the Q's were not, they need strength to sell in to, the DIA offers that, the Q's didn't, so it looks like they stepped in with some support as I mentioned earlier they may have to as to keep this bounce alive as it face mounting headwinds. The 2 min chart shows a clear intraday positive divergence before the Q's moved up.

 The 5 min chart is at price trend confirmation, but also at a resistance area from yesterday afternoon.

 Remember that we saw the Q's and Tech would rotate in BEFORE AAPL announced, that was based on this 15 min positive divergence, it is still looking good here and is actually leading compared to the 19th.

 SPY also with a reasonable consolidation

 The positive divergence to get the SPY moving is seen here on the 5 min chart.

 You may recall the SPY's strength for this bounce came on the 23rd when 3C refused to move lower with price, creating a leading positive divergence, so far it remains in line, but is looking very wedgey.

The 15 min is lagging in the SPY, this makes some sense as it was Techs turn to rotate in. It's not at a red line position as of yet, but we have seen these 15 min charts turn in an hour. So far though, the higher targets I had set in last night's post look like they are still on track.

PCLN / Tech Update

PCLN was another mentioned in looking for a good target area

PCLN already put in the positive divergence that has it moving as shown last night.

I'd like to start a position in PCLN, I'm feeling a bit overweighed in Tech right now so if I did, it would have to be a small position.

PCLN is in somewhat of a holding pattern right now, it formed a triangle (consolidation) and is lingering in the area. Now that Europe has closed, do we see the trend of $USD weakness to pull stocks higher? So far the EUR/USD is in the same consolidative holding pattern.

 Here are the target areas I marked last night for PCLN, note the very small bodied daily candle today, indicative of indecision. All of the averages right now are in a holding pattern, some worse than others such as the NDX.

 The 2 min XLK-Tech chart is still in line, I believe there is still the will to take the market higher, does Wall Street have the will though to throw more support in the mix if needed?

 The 3 min chart is showing what we expect to see in to higher prices, non-confirmation which leaves Tech in a leading negative divergence, this is normal and prices "can" still rise in this situation. We are supposed to see selling in to strength. It is when 3C shows an overwhelming negative divergence that we know they are preparing the market to move lower upon their completed mission.

 On the 5 min chart I'm giving what I think is probably the average accumulated price, distribution takes place only after prices are above this average position, we are in the area, but in my opinion not as high as we would normally see. So, more upside in the cards? I think that is the plan.

 PCLN's current move is being fed from this 15 min positive divergence from the 20th to the 24th, however the first signs of a negative divergence are appearing on this chart. A 15 min chart usually does not move very fast, but when it does, there's typically a very quick reversal following that divergence. I don't see this as red-line critical, but it is under way.

 Here's the short term 1 min PCLN, this negative divergence has thus far caused the holding pattern.

 The divergence has bled to the 2 min chart

 and now the 5 min chart. Should these worsen dramatically, the 15 min chart will decay and PCLN will be that much closer to its final upside destination.

 A closer view of the 15 min shows today's non-confirmation of the move higher which came late yesterday.

 Here's the holding pattern as of this capture.  It looks like PCLN is trying to break north of the triangle right now.

 Back to the XLK charts, the 15 min here still is in line, despite the underperformance today. My guess is we have enough support to get through today, who knows what comes out of the EU tomorrow though?

XLK 1 min is in line as well, so for the time being, I'm going to stay patient with PCLN as I already am a bit tech heavy. If price offers a nice price level, which reduces risk and the negative divergences are very strong, I will probably add some PCLN, otherwise because of my tech heavy positioning right now, I'll pass. In other words, only if the trade looks too good to pass up. Your situation may be different as you may not have the same exposure to tech that I have. I still like PCLN, but only at the price levels marked last night and shown above.

Quick Market Review

As is probably obvious by now, Tech is underperforming today, this is probably directly attributed to AAPL which I finally started my short position in yesterday. I guess you can't act too surprised that AAPL is taking a breather after having posted a nearly 9% gain yesterday, however a breather can quickly turn in to the downside reversal we are looking for in AAPL. This is one of the toughest calls to make, a market top. I use to laugh at people who even tried, but with the tools we have and the immense market volatility, it's almost imperative that we try. The difference between being short AAPL here and 10% higher, for some people, could be the difference between having an AAPL short and facing a very emotional time in which abandoning the position is considered. I have faith in the longer term charts so it's not an issue for me so much, but I can't deny that emotions naturally and regrettably can get in the way of otherwise solid analysis.

I want to briefly cover the macro environment as sentiment right now is probably the most important issue regarding the near term price direction sustainability. Yesterday I said very directly that one more perfect storm in Europe like we just saw, could send Wiley Coyote finally looking down and getting reacquainted with gravity, despite what Wall Street has planned in the near term.

Deutsche Bank, the BAC of Europe, reported very poor earnings today. The Capital shortfall in EU banks is not an easy problem to fix, ultimately there probably isn't a fix, but despite the German public and government's protests, it's looking more and more like the ECB will have to come up with some sort of liquidity injection. We know there's not only  capital problem, but a liquidity problem as well (think of this as cash flow vs profits or the cushion against further contagion, there is clearly a problem in both).

As a result of this problem that has manifested in the repatriation of Euros (talked about recently), news is out today that there is an "initiative" under way to allow EU banks to access cash from the ESM which is supposed to be a firewall. If the limited funding of the ESM (which is not enough to deal with Spain if it get much worse) is going to be deployed to the banking sector, than the EU banking problem is much bigger than we thought. The timeline in which this may be completed is two weeks, meaning it is situation critical. Spanish banks don't have the funding that corporations depend on (in the EU corporations depend on an average of 70% of their funding from the banking sector vs the US at 30%).

Germany is already kicking and screaming about this proposal, but as mentioned, with the French elections and voter sentiment, it is looking more and more like the divide between north and south in the EU is leaning away from Germany, after all it looks like Germany is about to lose it's biggest ally in the French elections.

The implications here of the ESM being used for bank funding are probably a lot larger than I can describe, it's a big problem.

We also saw European Confidence Indications hit 2009 lows today; Economic, Manufacturing, Services, Consumer and Business Climate all came in a large misses. This only accelerates the flight of capital out of the EU banking sector.

10 EU member states (with the UK joining the list this week) have entered a double dip recession.

In the US this morning, Initial Claims missed-no surprise, just look at the Economic Surprise Index linked on the site.


Released On 4/26/2012 8:30:00 AM For wk4/21, 2012
PriorConsensusConsensus RangeActual
New Claims - Level386 K375 K361 K to 380 K388 K
4-week Moving Average - Level374.75 K381.75 K
New Claims - Change-2 K-1 K


I find it a bit surprising the market has weathered the IC and Euro news as well as it has thus far, perhaps one of the reasons was the revision of the prior from 386k to 389k. You would think the higher revision would be taken bearishly, but the Financial media (Wall Street propaganda arm) has spun this to look bullish, the logic is this week's miss at 388k is a decline from last week's upwardly revised 389k print, in reality both are bad news, however just to add some more confusion, the QE crowd sees bad news as good news-the rationale being the worse the economy declines, the higher the probability of more QE. The trend here is 10 consecutive weeks of misses and 16 of the last 18 have missed, revisions of the prior week's data higher are a given. This is bad, but because of the number of people falling off the 99 week benefits, the data actually looks better than it is!

So with the market in somewhat of a holding pattern, it is actually much stronger than it could otherwise be had Wall Street not set this volatility shakeout cycle in motion. The question is, can they reach their goals before the economic data overwhelms the small accumulated positions used to pump the market higher?

We are definitely getting in to a very sticky patch, thus I continue to look for opportunities to add shorts in to strength.


GDX/GDXJ Update

I have an options model portfolio trade in GDXJ May $21.63 (odd strike?) calls, I have a 30% gain this morning in them and it seems many of you have entered the same trade as I have received a lot of emails about it this morning.

This is a tough one to call, I'll just remind everyone the same thing I've said in a few emails about it this morning, "Bears make money, bulls make money, pig get slaughtered". At the same time, I don't want to leave reasonably potential profit on the table. You'll see the issue in the update below, but before that let me mention a compromise you may want to consider if your position size makes it feasible, you could take your original investment of the call cost off the table and let the profits run or take some percentage of partial profits. We just don't want to see a winner turn in to a loser and any significant pullback could start to effect gains via the call's time decay.

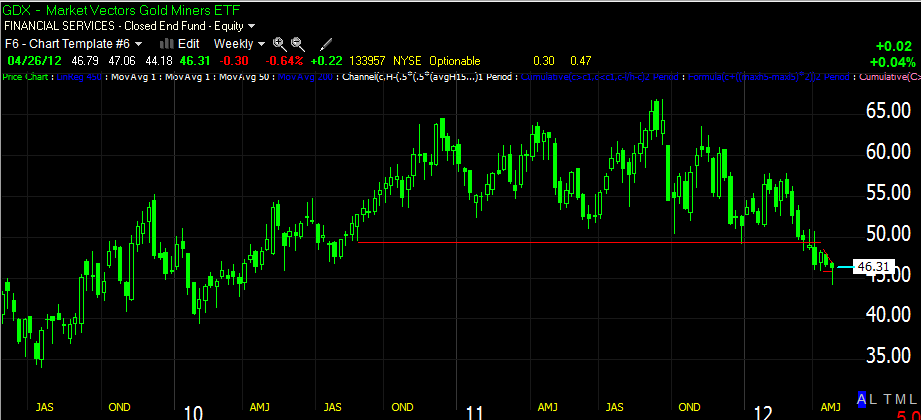
 This 5 day chart of GDX (GDXJ is similar just with less history) is why I'm not bullish on these too for anything more than a volatility bounce.

 GDX daily, the major support of the trendline shown above was broken, then a descending triangle formed which is considered by TA to be a bearish consolidation/continuation pattern. When we see these after important support is broken, it's almost a given there will be manipulation of the pattern with a head fake bounce higher to shakeout the shorts that entered on the break of major support and upon seeing the bearish continuation consolidation. Just looking at the price chart alone and thinking in terms of market psychology, it wouldn't make much sense to bounce the miners unless it served a purpose, that would be to shakeout the shorts. Based on that alone, a move in GDX (I favor GDXJ and that's where my position is) would have to break above the apex of the descending triangle which it pretty much has today, a better move would be a move to the $47 area so the triangle looks like a failed price pattern, but ultimately to shakeout the most shorts, a move above the long term trend line in the $50 area would be the ideal target. At the red arrow we see a bullish Hammer candlestick which implies a reversal (no target for the reversal is indicated with a hammer, just that lower prices were rejected and short term support was established). At the white arrows we have a confirmed reversal on rising volume, so far so good.

 The GDXJ daily chart is similar, but with the descending triangle above long term support, it has the same implication though and long term support was broken. Again there's a bullish Hammer reversal candlestick at the red arrow and a confirmation of the hammer at the white arrow on rising volume. The rising volume is likely to a large degree, shorts stopping out on a failed test of resistance and today we are just above former support, turned resistance and now back to support.

 Here's where the trades get tricky, surprisingly the long term 60 min and 30 min charts in GDX and to a greater degree in GDXJ, show pretty serious looking leading positive divergences. The approximate accumulation area is in the green box so for the trade to be worthwhile, prices should move above the accumulation area before any strong distribution of the head fake move start appearing.

 It's the very near term on the short end like this 2 min chart that show some non-confirmation, this suggests at least a pullback.

 The 5 min positive divergence that prepped the miners for a move higher (this is likely market maker or in this case Specialist accumulation as they know what the bigger picture is a they likely filled the order that created the  30-60 min positive divergences. It use to be  that about 30% of a stock's daily trading volume was attributed to market makers/specialists trading their own account. That percentage may be lower with High Frequency traders front running the traditional middle men and acting as the source of liquidity, although they are not regulated by the same laws that the middle men are (for example, they are under no obligation to provide liquidity at market orders, so when the market goes south, the HFTs simply shut down their liquidity operations. The HfT's are primarily in the business of predatory trading against Wall Street itself and much of that is focussed on front running market makers and specialists in order to generate order flow and cash in on volume rebates. In any case, there's a relative negative divergence here too, so the probability of a consolidation or a pullback is growing, with limited time to the expiration and time decay working against us, these corrections are not helpful in an options trade.

 GDXJ 15 min is about in line and looking pretty good, it's the shorter chart and pullback that concern me and there is the dilemma, take profits before time decay starts picking up or hold and look for the bigger move that the 30/60 minute charts are indicating?


 GDXJ is right above support so this is an ideal area for a consolidation. RSI does look constructive here.


Using an hourly version of my X-over screen, we have a short term confirmed long signal. The first pullback is usually to the rising 10 bar (60 min chart) moving average. GDXJ is already consolidating in a triangle since 10:15 so the consolidation part was correct. For now, I'm going to ride this position out and keep a close eye on price relative to the 60 min 10-bar moving average.