Tuesday, May 22, 2012

S Chart

I've been asked about S several times so I thought I'd just share it with everyone, this is a tough nut to crack, but I think we have a short term direction at least that may be worth a look.

 This is a long term 5 day chart of S to give some perspective.

 Recently S put in what looked like a bottom, to the left there's a capitulation day, it was quite heavy volume, we saw a "W" type base form, volume drop off as it should and as you'll see, a 3C positive divergence in the area leading to the March rally. I'm sure the AT&T 5 year exclusive on the I-phone ending is a plus for Sprint. RSI was also positive at the base (RSI 22) and now we have a triangle consolidation that is pretty mature.

 Here's the triangle, from the rally off the "W" base (of the chart to the left), it topped with a bearish engulfing candle and the trend has been down. Technical traders may have some trouble interpreting the triangle as it is very low in S's price range, but the Technical Analysis books all tell them that it's a consolidation/continuation pattern and the preceding trend was down, so if they are following the textbooks as they usually do, they'd be looking for another leg down in S based on the triangle, also note volume is correct for a triangle. I have a feeling at least in the near term, S will surprise and break to the upside, after that it's not so clear, but I'd stick with the larger bearish trend in the market so "S" may be offering a couple of different opportunities, a short term breakout play, a possible head fake breakout move or least likely, a move higher which would be difficult to go against the prevailing bearish trend in the market, but there are at least 2 potential trades: 1) now -breakout to the upside and 2) possibly later-short a head fake breakout move-we'll have to see how the charts develop).


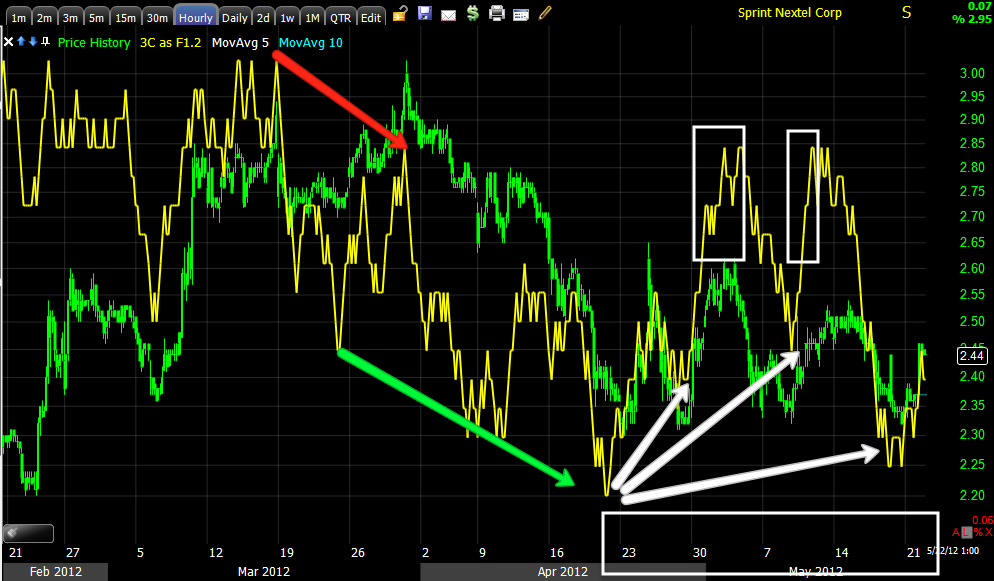
 The daily 3C chart has worked well, calling the top last May and a positive divergence in that "W" base I mentioned above, right now in the triangle there's a small daily positive divergence.

 On a 60 min chart we see the end of the move up from the "W" base with a neg. divergence and then trend confirmation to the downside. In the triangle there have been several positive divergences.

 The 30 min chart is showing prices being brought back down inside the triangle where they would be accumulated at the lows of the triangle as seen above on the 60 min chart, there's also a leading positive move on this price move that looks like the start of an attempted breakout, S will probably need some market support to pull it off.

 The 15 min chart shows the same, and this is the purpose of a triangle, to keep price in an accumulation area and knock it back down when it rises too high from the accumulation zone.

 The 5 min chart shows  positive divergences at the lows and a leading positive as the triangle matures toward the apex.

The 2 min chart is showing the same concepts as above and some difficulty in the attempt to breakout today, which is most probably market related.

$2.50 is about where S would breakout, the price pattern implied target would be around $2.85, maybe a bit closer to $3.00. The 60 min trend channel has held all of the swings inside the triangle, the level to watch for a failure of this attempt would be under $2.38.

Lastly, obvious price patterns like this are often shaken out before they move in the intended direction, so I'd also watch for a break below support of the triangle (the break below $2.38 would be your first hint) and then a move back in to the triangle. That would lead to a higher probability trade and a stronger breakout. We see these kind of head fake shakeouts a majority of the time and they often represent good opportunities to fade the head fake move. We may not see it in this case if the overall broad market gets upside momentum under it again.

Feel free to email for an update in case of a break below the triangle, we can usually see accumulation showing it's a head fake move and that offers an excellent entry point. S is also option-able, but as with any long trade tight now, I view them all as speculative for risk management planning.


ES Signal moving fast

In just a minute or two the ES signal is moving toward a leading positive...

This is the choppiness I mentioned before as long as we are under resistance, 3C 1 min is showing the same kind of retail shorting seen yesterday in the afternoon.

I'm putting up another post, but I'll return to the market update, it needs a little longer for some of the signals to resolve any way.

 This is the kind of action retail is looking for to short in to, what looks to be a failure of a test of resistance, as I mentioned earlier, Wall Street will likely throw retail a bone in that regard and with the Euro down, now is as good a time as any.

 ES doesn't look too bad, it went negative earlier as shown in a previous update and has remained a little better than in line, a little more positive as 3C should be lower on confirmation and we have this initial tick up, so we'll see how that develops, I'm glad I addressed this early today so you understand what to look for, what is normal and what is a real change.

As you can see the Euro's continued downside this morning is just too much for the arbitrage players not to take advantage of as well as retail shorts.

I'm not too concerned about it in the bigger picture of a move up.

I'll be back with more after the next post.

Market Update

 Still near term, but a little longer view will be resistance at the red trendline coming up, traders will be expecting a failure of a test of resistance and look to short the SPY right at that level, Wall Street may very well throw them a bone and give them reason to believe a test of resistance will fail there so we'll have to watch for that as we move closer, we are pretty much in the vicinity where traders will start to look for that failure so trade could get choppy soon. A break above that resistance level which I believe will come, will be the catalyst to really get a short squeeze underway, just an FYI of what you might expect to see.


Intraday, just as ES held up well with the Euro correlation being negative, the SPY thus far is holding up very well considering the Euro is lower today than yesterday from the overnight action. In the near term today this may start to act as a drag, but I think the Euro pullback probably isn't that serious and it should get moving higher giving more support to the market.

 ES has a small negative divergence, but the larger theme is confirmation.

 Yesterday the CONTEXT Model wasn't looking supportive of ES, now it's very close to ES and much more supportive than yesterday , the two are trading nearly in sync. We'll see later what the details are in a Risk Asset Update.

 The DIA has been the laggard in 3C and remains so, the 1 min chart shows a negative divergence, however the fact 3C is pointing up and doesn't have a inflection point down leaves room for improvement. It has been a market trend lately for early morning gains to fall off, especially big ones and then pick p in the more important and more closely watched afternoon trade.

 DIA 2 min trend is starting to show confirmation, which is an improvement for the DIA.

 The 5 min trend is also showing confirmation of price action. this is an improvement for the DIA and suggests that short term intraday action on the 1 min chart is largely noise and Euro arbitrage.

 The WIM is showing a 1 min intraday negative divergence here, it's not surprising, what is surprising is the market's strength given the Euro's current position, but we have to remember the context of what is really going on here.

 IWM 1 min trend, from a positive divergence at the Friday/Monday lows, largely confirmation of the move higher with a few smaller negative divergences creating consolidations intraday.

 IWM 5 min is leading positive-Remember the longer the timeframe, the more weight it carries so a 1 min negative divergence may effect intraday trade, but as long as the longer charts are positive like this, we can expect pullbacks and such to resolve to the upside.


 Most importantly is the IWM 15 min leading positive divergence.

 QQQ 1 min showing a negative intraday divergence

 Again, the 15 min leading positive is like the rock to the 1 min chart's scissors.

 SPY 1 min also has a negative divergence, but 3C hasn't turned down since the capture so there's room for improvement intraday.

 The 1 min trend with the theme being confirmation, we saw a slight pullback/consolidation at yesterday's negative divergence.

 SPY 2 min trend

SPY 5 min trend is leading positive.

All in all, it's just probabilities and patience.

My Sentiment Indicator

One of my long term members, I think he's been with me since WOWS was started, Sam, is an invaluable resource for all of us as he's up on all of the blogs, Twit Streams, etc. He feeds me excellent information about trader sentiment that I otherwise don't have time to seek out as thoroughly as he can.

Here's an email he sent this morning,

"Hi Brandt,

It's interesting to see how everyone has gone bearish still after the
rally yesterday.  The LDI admitted he bought IWM puts on Friday and
closed them at an immediate loss same day.  Technically people see no
reason for any sustained rally and see an opportunity to short the
indexes at any sign of weakness."


The "LDI" are the initials of a trader who is ALWAYS wrong, so much so we track what he's doing just for fun as a contrarian indicator, we call it the "LDI Indicator"

In any case, Sam points out, everyone is still very bearish and Technically people see no
reason for any sustained rally and see an opportunity to short the
indexes at any sign of weakness

Sam and I are on the same page, he's been around WOWS for a long time and has a great nose for the market and the games Wall Street plays.

The point here being, as I have mentioned nearly every time I bring up the probability of a strong bounce, "There's no reason to move the market higher if it's not going to shift sentiment, squeeze shorts, get the bears to start second guessing their views and maybe, just maybe if the move is strong enough, to lure in unsuspecting bulls and set a bull trap which will add downside momentum when the bounce reverses.

What traders are feeling is exactly right, Technically THERE IS NO REASON FOR A RALLY, TECHNICALLY.

However after years of observing 3C and the market, you begin to realize that short term trading action has NOTHING to do with the market's discounting mechanism or what's left of it. Short term trade, bounces, counter trend rallies, etc. are all used simply to make the most number of traders wrong at any one point in time and with everyone leaning to the bearish side of the boat, Wall Street can't make money trading with the very same sheep they are trying to fleece. Technically there's no reason, psychologically there is a reason, Squeeze the shorts, set up better entries in short positions, make a quick buck on the move up and hopefully trap some bulls to add extra momentum to the next leg down. This is what Wall Street has always been in some form, whether brainwashing generations of retail investors in to believing "Buy and Hold" is a sound strategy or "Dollar Cost Averaging" on a losing position is a sound strategy, the propaganda goes something like this, "If XYZ was a good deal at $40, it's a STEAL at $20!" 

These are generational themes that Wall Street used especially before the advent of online brokers. For 1 it kept money in funds like Mutual funds that almost ALWAYS lose money in a bear market as long only funds. It keeps everyone's 401k in the fund and people buy this non-sense or at least they did.

Now that people trade their own accounts via cheap online brokers (the days of an $80 broker trade are long gone), the game has shifted more heavily in favor of short term manipulation of the markets. Once you realize this and can spot it, it becomes an advantage you have over the masses, this is how we built our short positions, by shorting price strength that the herd of sheep were buying.

In any case, every top is different and they all get very unpredictable just before the landslide move down. While I firmly believe the probabilities are for a strong bounce or counter trend move up a we have seen start, the details of how that unfolds are much harder to predict, that's why we watch the market every day closely and update it. A move up could be a 3-5 day non stop rip-fest to the upside, it could also be a few days up, a couple of nasty days down to lock in more shorts and continue higher. The point is as things get more unpredictable, the "How" becomes difficult to predict, the "Why?" is much easier and the overall idea is quite simple. I've believed in this final move up, I've stuck with my beliefs for one reason, EVIDENCE. We'll have to see how this all plays out, what the tactics will be, but the strategy is much more simple-I won't repeat it, but it's above and starts with "Squeeze the shorts..."

This is where patience pays off, LET THE TRADE COME TO YOU! It's emotionally difficult to go long some speculative longs for a bounce when the market is in a free-fall, but that's exactly what many of us did and we are seeing the rewards, whether it's to make a little extra $, to hedge shorts or both.  

My Speculative AAPL June $540 calls are up over 65% this morning, and my AAPL short is still doing fine although I have accepted the fact I'll see some draw down i those shorts on a bounce higher, but it's not worth it for me to try to get too fancy right now in trading around positions.

Keep in mind, most of what you see in price action is deceptive. This mov higher has no fundamental reason, there's no technical reason (especially after this morning's US data), there is a psychological reason and when you understand how the heard will react, Wall Street itself becomes a lot more predictable.


Hey, Check out JPM

I just posted yesterday, JPM In Bigger Trouble, As Suspected...

In that post I said I'd like to short JPM if it can rise toward the $38-$40 gap area and to set some price alerts. The strategy is simple, there are thousands of stocks to play, let the trade come to you, if it doesn't move on to the next.  Take a look this a.m.

Up 5% above $34, we may just get our chance after all!

Overnight and into the open

Japan's sovereign rating was downgraded 1 notch from AA to A+ / Outlook:Negative by Fitch in a somewhat surprising move.

UK CPI missed by a smidge, but dropped sequentially from 3.5 to 3.0 (consensus 3.1), that caused some overnight selling in the Sterling.

Greece is to receive $18bn to go toward recapitalizing their banks which have seen massive, sustained bank runs. There was some rally on that news, but ultimately everything flattened out as this is not new news, it's part of a scheduled release, whether the Greeks actually use the money where it was meant to go is another story entirely.

As mentioned Sunday about headlines, etc, The Euro-summit looks to be a bomb for the exact reasons mentioned Sunday, France who has shifted away from the German-Franco alliance and more toward a PIIGS alliance supports Euro-Bonds, Germany never has. From Reuters:

"Germany does not believe that jointly issued euro zone bonds offer a solution to the bloc's debt crisis and will not change its stance despite calls from France and other countries to consider such a step, a senior German official said on Tuesday. "That's a firm conviction which will not change in June," the official said at a German government briefing before an informal summit of EU leaders on Wednesday. The official, requesting anonymity, also said he saw no need for leaders to discuss a loosening of deficit goals for struggling euro zone countries like Greece or Spain, nor to explore new ways for recapitalise vulnerable banks at Wednesday's meeting." 

The FT and Bloomberg carried the headlines that size up the Euro-Summit,  "France to push for Euro Bonds" and "Merkel says she won't shy away from a clash with Hollande at the Euro Summit"

So nothing new or unexpected, go about your business, nothing to see here except the formerly slow motion train wreck that is Europe gaining speed.

In Switzerland the parliament will discuss the issuance of a Gold Franc, which is ironic as I was just talking to a member a few days ago about this very scenario, not sure of who the country would be, but that at some point someone who is big enough will challenge the $USD reserve currency status with a gold backed currency.

Those are the overnight headlines, the EUR/USD and ES action looked like this...

 You unfortunately can't see the entire ES overnight action as this is as far as I can zoom out on a 1 min. chart, but ES held up well as I suspected it would, only dropping below the level I published in the midnight update , very briefly (under the red trendline). The strength in ES continued despite some Euro weakness or more Euro weakness from last night's post.

 The Euro lost a little more ground and dipped below the base area's support level, still well above the 2 + week downtrend.

Here's the larger view.

So with the Euro dropping, all in all ES held up pretty well, but I wouldn't be surprised to see the market pullback a bit toward the correlation in which thus far ES has held above.

As an item of simple curiousity, the FB sell-off continues and in the headlines the finger pointing has begun, of course most fingers pointed at MS, again I suspect they made a business decision in seeing the book order flow and decided not to let th profits of the IPO be wasted trying to defend FB against a flood of sell orders.

FB this a.m. This is close to a 30% drop since Friday's highs.

In the US we have Existing Home Sales which were soft...

Released On 5/22/2012 10:00:00 AM For Apr, 2012
PriorConsensusConsensus RangeActual
Existing Home Sales - Level - SAAR4.48 M4.660 M4.500 M to 4.850 M4.62 M
Existing Home Sales - M/M Change-2.6 %3.4 %

Missing consensus by a bit, most of the weakness was in the revised March number at 4.48m units, down from 4.6 mn units.

The Richmond F_E_D Manufacturing Index was also a disappointment just minutes ago...


PriorConsensusConsensus RangeActual
level change14 11 3  to 15 4 


Coming in at 4 on lower consensus of 11  and prior of 14. This manufacturing index is of significant importance since last Thursday’s Philly Fed survey had shown a contraction by -5.8 in May (consensus of 10, from previous 8.5). This means there are growing reasons for concern regarding the manufacturing side of the US economy.


Thus far the market is taking it in stride, can you guess why? I'll address that in the next post, but I think you have an idea.


SPY this a.m. since the two disappointing eco-data releases at 10 a.m.


That's about it for US data except for a 4 week bill auction and a 2 year note auction


Midnight Update

First lets start with ES, then I want to give you a feel for the bounce potential.

 Since the close Es has remained flat near the highs, 3C is in a 1 min negative divergence so I wouldn't be surprised if ES pulled back overnight, but when you see the next chart, you'll understand how well ES is actually holding up.

 Here's the Euro since the 9:30 open to the 4 pm close, note the Euro has dropped off since then, ES has not, the correlation is fairly strong and ES holding near the highs looks like an exhibit of strength, I believe in part because for those in the know, the Euro pullback probably isn't all that serious. The orange area is where it was a little sticky in 3C and the market today, but the market again held better than the correlation would suggest.

 The multi week trndline has been broken and the base's first level of resistance has been broken and is holding, I believe the Euro will put in more gains and while some claim it is Euro repatriation from the EU banks selling $USD denominated assets, I might be inclined to agree had we not seen this move coming in the Euro last Tuesday before it even started.

 Here's the next level of resistance for the Euro, should it break above $1.30, watch out above, serious upside momentum and a serious market bounce that will have most shorts thinking or rethinking their positioning, I won't be this is exactly the kind of bounce I have been waiting for and expecting and even better, thus far, it's tech /AAPL led as suspected.

Now for the upside potential-it looks pretty amazing. This is exactly what we have been waiting for and expecting, not a correction from oversold, but a true Wall Street initiated cycle.

 The Euro 1 min today was a little touchy mid afternoon, but that resolved to the upside in a strong way.

 The 5 min is moving toward a leading positive position.

 Look at the 30 min leading positive divergence, this suggests the Euro has a lot more upside, again, repatriation, short squeeze, etc... No, this looks to be a typical Wall Street run cycle.

 Just for confirmation, a leading negative 30 min in the $USD!

 The DIA which has been the laggard is finally showing underlying strength with this 15 min leading positive, all of which was put in today alone!

 IWM 15 min leading positive, all today

 AAPL is helping the Q's, look at this 15 min leading positive and all in one day.

 The Q's as most other averages on a longer term timeframe have stayed in a leading positive position, this is why I had not given up on a strong move up, today just added to it with a new leading positive high.

 SPY 15 min leading positive today alone

 And the longer term 15 min trend has stayed leading positive through all the downside.

 As for the flight to safety trade, TLT/Treasuries, that's a massive 5 min leading negative divergence, I'd expect treasuries to fall hard.

 TLT 15 min leading negative-more evidence of distribution in the flight to safety trade.

 Just to confirm, here's TBT, the Treasury Ultrashort in a 5 min leading positive position. This should take off, even though it's not high Beta, it is optionable.

And TBT 15 min leading positive, look for upside in the Ultrashort and downside in Treasuries.

The bottom line, last Tuesday we saw the change in character in 3C in the Euro and $USD, since then they have developed nicely, they now are looking like they'll lead the market to a strong move and as I have said, there's no reason to run a bounce cycle unless it's going to knock a lot of shorts out and maybe even suck in some longs so be prepared to be moved emotionally, but remember the forest, this market is in huge trouble, this is just a great potential set up for us, as I say and believe, LET THE TRADE COME TO YOU!

I'm not concerned about ES overnight or the Euro with these divergences, these are the clearest, strongest divergences of the entire top, which would suggest one of the strongest moves up of the entire top, just remember if you start to doubt the short side or weakness in the market, we have signals that are strong enough now to lead the market much higher, remember we expected this and remember what we want to use it for-SHORT STRENGTH!


This looks like it will be an exciting week, I'll try to get some speculative longs up for you, but I think just about anything Tech will move, but remember, these are speculative, even in a strong bounce, it's a trade that runs counter to our major market perspective.