I've been asked about S several times so I thought I'd just share it with everyone, this is a tough nut to crack, but I think we have a short term direction at least that may be worth a look.
This is a long term 5 day chart of S to give some perspective.
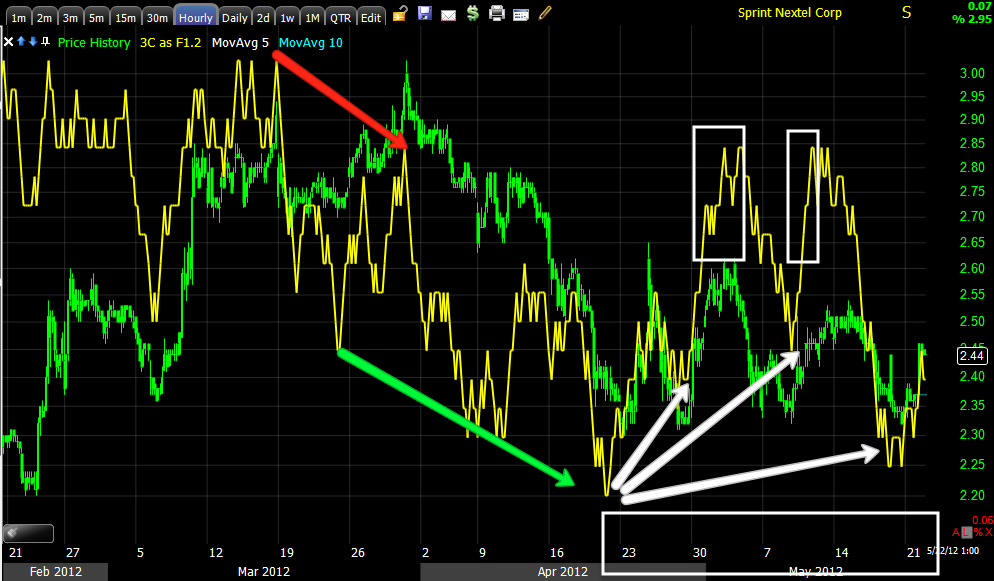
Recently S put in what looked like a bottom, to the left there's a capitulation day, it was quite heavy volume, we saw a "W" type base form, volume drop off as it should and as you'll see, a 3C positive divergence in the area leading to the March rally. I'm sure the AT&T 5 year exclusive on the I-phone ending is a plus for Sprint. RSI was also positive at the base (RSI 22) and now we have a triangle consolidation that is pretty mature.

Here's the triangle, from the rally off the "W" base (of the chart to the left), it topped with a bearish engulfing candle and the trend has been down. Technical traders may have some trouble interpreting the triangle as it is very low in S's price range, but the Technical Analysis books all tell them that it's a consolidation/continuation pattern and the preceding trend was down, so if they are following the textbooks as they usually do, they'd be looking for another leg down in S based on the triangle, also note volume is correct for a triangle. I have a feeling at least in the near term, S will surprise and break to the upside, after that it's not so clear, but I'd stick with the larger bearish trend in the market so "S" may be offering a couple of different opportunities, a short term breakout play, a possible head fake breakout move or least likely, a move higher which would be difficult to go against the prevailing bearish trend in the market, but there are at least 2 potential trades: 1) now -breakout to the upside and 2) possibly later-short a head fake breakout move-we'll have to see how the charts develop).

The daily 3C chart has worked well, calling the top last May and a positive divergence in that "W" base I mentioned above, right now in the triangle there's a small daily positive divergence.
On a 60 min chart we see the end of the move up from the "W" base with a neg. divergence and then trend confirmation to the downside. In the triangle there have been several positive divergences.
The 30 min chart is showing prices being brought back down inside the triangle where they would be accumulated at the lows of the triangle as seen above on the 60 min chart, there's also a leading positive move on this price move that looks like the start of an attempted breakout, S will probably need some market support to pull it off.
The 15 min chart shows the same, and this is the purpose of a triangle, to keep price in an accumulation area and knock it back down when it rises too high from the accumulation zone.
The 5 min chart shows positive divergences at the lows and a leading positive as the triangle matures toward the apex.
The 2 min chart is showing the same concepts as above and some difficulty in the attempt to breakout today, which is most probably market related.
$2.50 is about where S would breakout, the price pattern implied target would be around $2.85, maybe a bit closer to $3.00. The 60 min trend channel has held all of the swings inside the triangle, the level to watch for a failure of this attempt would be under $2.38.
Lastly, obvious price patterns like this are often shaken out before they move in the intended direction, so I'd also watch for a break below support of the triangle (the break below $2.38 would be your first hint) and then a move back in to the triangle. That would lead to a higher probability trade and a stronger breakout. We see these kind of head fake shakeouts a majority of the time and they often represent good opportunities to fade the head fake move. We may not see it in this case if the overall broad market gets upside momentum under it again.
Feel free to email for an update in case of a break below the triangle, we can usually see accumulation showing it's a head fake move and that offers an excellent entry point. S is also option-able, but as with any long trade tight now, I view them all as speculative for risk management planning.


No comments:
Post a Comment