Monday, July 30, 2012

Tech and AAPL

These are just more pieces of the puzzle, I'm still trying to work out whether we are going to be looking at a new puzzle with all of the back and forth over MAJOR policy issues in the EU this week, which MUST effect F_O_M_C policy in the US this week. Draghi really picked one heck of a time to stir up the bottom!

First I became interested in the 5 min leading negative divergence in the QQQ, that led me to AAPL naturally.

QQQ Daily chart with a bear flag-like consolidation. According to the precepts of Technical Analysis, this is how a Technical Trader would expect this pattern to play out, the consolidation AWAY from the preceding trend is confirmation that it is indeed a continuation consolidation and the expectation would be for a break to the downside, continuing the preceding trend. So far this works out well with the trend assumptions we've held for several weeks, 1) a short term break to the downside which sucks in shorts 2) that to be a head fake move and a long and stronger move to the upside using the shorts as fuel as they cover and send the market higher, finally the longs jump in on this impressive move to the upside and the trend reverses to the downside this time using the long as fuel to power the move lower back to the primary down trend that started around April.

Does Draghi, the ECB and Germany change all of this? Even perhaps delay it and cause the trends to change slightly? For instance, "if" the market was suppossed to have already broken down in to our short term downtrend and this week's F_O_M_C meeting was to be the catalyst to send the market up on our next trend leg expectation, that would alter the short term downtrend view. Of course we can't know what the ECB or F_O_M_C will do, this is just an example, but it seems that Draghi's sudden change of heart (and it's a BIG ONE) was unforeseen by the market.


 QQQ intraday 1 min is negative for the most part, there is a small positive divergence, maybe we get some intraday upside volatility.

 The trend of the 2 min chart doesn't look good for the market, this would be in line with our short term down trend thinking.

 This is what grabbed my attention, how fast and deep the QQQ 5 min leading negative divergence is today.

 The longer term QQQ 5 min trend, today's move looks strong

 So I looked at AAPL which has a price formation that is the opposite of the QQQ, a bullish flag. Traders would expect AAPL to follow the green arrows, the problem is AAPL already broke to the downside, this stopped out a lot of longs, just look at the volume on the day AAPL broke below the flag. Could APL be entering the flag setting up what Technical analysis would call a "Textbook short"? If so, then those shorts would still be in line with the move expected in the QQQ and they too would most likely be used as fuel for an upside move in AAPL that is along the lines of the sub-intermediate uptrend that was expected after the short term move down.

 AAPL 2 min is largely negative on the day, but also showing a small intraday positive divergence.

 The 3 min chart, like the QQQ 5 min, is leading negative badly.

 As is the 5 min chart of AAPL.


Here's the 5 min chart intraday.

Basically this still looks like our trend expectations are still correct.

A Quick Look at GLD

GLD as of last week looked very much like it was going to turn down and perhaps move back to the lower end of a range that "seems" to be building a longer term base for a longer term move to the upside. There are "hints" that there is some enthusiasm in gold today based on the bad Dallas F_E_D print, which in the mind of those who hope for more QE from the F_O_M_C, all economic bad news is good news for further QE and it tends to show up in gold as gold tends to be one of the biggest beneficiaries of QE or dollar debasement.

Let me stress that this is just an initial hint as some enthusiasm in GLD, I believe it would have to show much more to keep it from turning down as it looked like it was setting up to do last week.

 The 5 min chart showing GLD in a leading negative position, this would suggest that GLD's very recent 3C movement appears that GLD was preparing for a move to the downside, this is not necessarily bearish if it is accumulated at lower prices as we have seen recently.

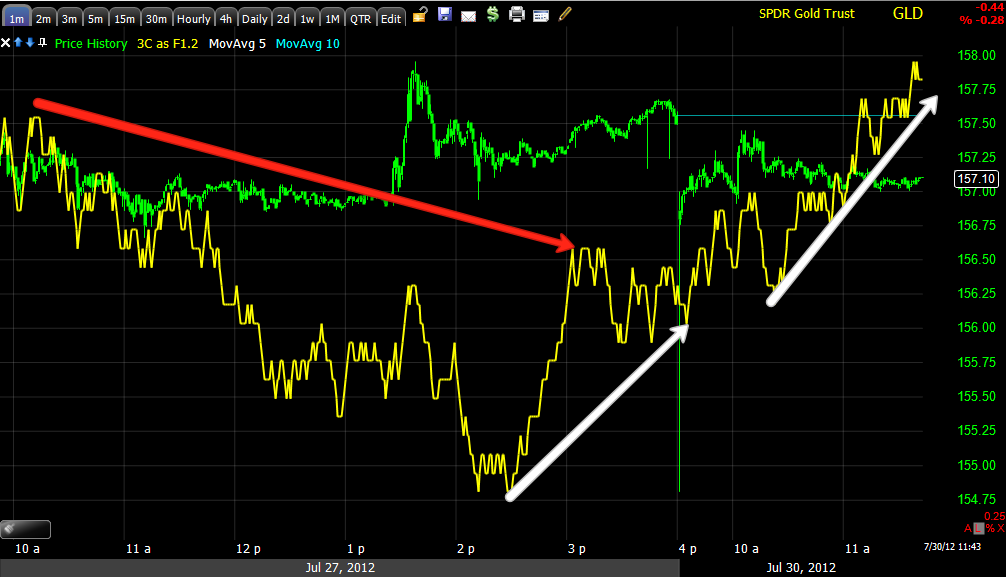
 However this morning on a faster 1 min chart, we saw a positive divergence on the open keeping GLD from falling more and since the Dallas F_E_D print, the 1 min chart has moved to a leading positive divergence on the day during a flat trading range (often flat trading ranges are where we see institutional activity).

While this looks interesting, we must keep in mind this is only a 1 min chart and this is a VERY new move, it could be the 1 min positive action is simply keeping GLD in a consolidation position.

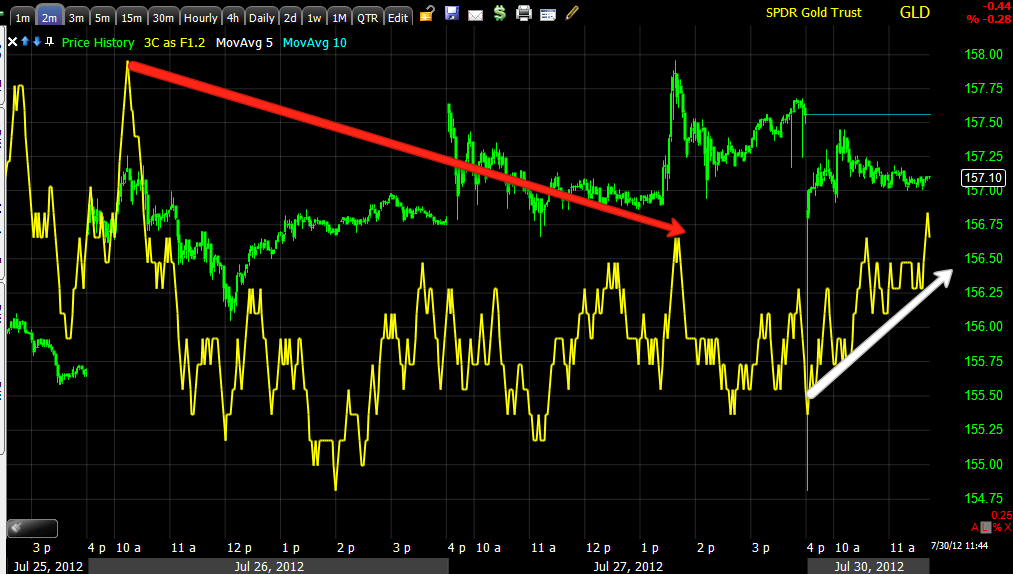
 While the overall trend of the 2 min chart also is negative and suggests GLD is about to turn down, we see some of that 1 min positive divergence bleeding through to the 2 min chart on an intraday basis, however, compared to the trend you can see this is very preliminary.


The next timeframe, 3 min IS NOT seeing any of the migration of the 1 min positive divergence, this will be something I'll be looking for and a chart I'll be watching closely. The highest probabilities are still for GLD to pullback, but we do have the start of a new and interesting trend, it's just a start, but worth keeping a close eye on.

Dallas F_E_D Misses BIG

Expectations were for a print of +1.9, the headline print came in at -13.2! The print is the lowest since last September, but as always, the devil is in the details.

The main print is almost as bad as it was back in 2009, the General Business activity Index saw a MtM change of -19 points which is the worst since APRIL OF 2005! The Outlook For Capital Expenditures saw a huge disappointment.

Not good news at all, which the market usually takes as GREAT news on hopes of more QE or QE3 and with the F_O_M_C meeting this week, the market's reaction is curious, gold's reaction is even more curious.

 SPY's reaction

GLD's reaction...

Time to take a closer look at GLD.

Market Update

In keeping with trying to look at what is happening today, as we move further in to the day, longer timeframes of 3C have had time to catch up, so here's an update.

The intraday charts are falling in line with the trends I showed you in the first update today. These are 1, 2, 3 and 5 min charts, several of the 5 min charts are leading negative badly on the day.


 DIA 1 min

 DIA 2 m

 DIA 3 m

 DIA 5 min-That's a nasty looking divergence.


 IWM 1 m

 IWM 2 min

 IWM 3 min falling apart


 IWM 5 min following

 QQQ 1 m

 QQQ 2 m


 QQQ 3 min-starting to lead negative

 QQQ 5 min-looking bad.

 SPY 1 m


 SPY 2 min looking bad here

 SPY 3 min starting to lead negative


SPY 5 min not looking good at all.


Risk Asset Update

It's early to look at the risk asset update layout, but considering, I thought I should take a look. There are some warning signs and there are some signs that look like confusion, although I doubt that is what they truly are.

 High Yield Credit tends to be one of the first choices for a risk on move among the many different forms of credit, however HY credit hasn't made a higher high with the SPX in 2+ days now.

 Yields tend to act like a magnet for equities, this very sudden and sharp drop is something we'd normally take as a warning or reversal sign for the market.

 Here's the same chart on a longer timeframe and you can see the SPX reversal to the downside on a little longer divergence in yields, but not as sharp as today's thus far.

 A break in the correlation between the SPX and the Euro is also normally taken as a warning sign that the SPX may be getting ready to follow the Euro, here the Euro has a pretty sharp break down.

 On a longer time frame you can see where past breaks of the SPX/Euro correlation have led to market reversals to the downside, this one is pretty deep already.

Sector rotation is where it appears there's confusion, usually either we have a risk on sector rotation or a safe haven rotation, here we have both with Financials, Basic Materials and Tech to some degree, rotating in, but at the same time, Energy and Discretionary aren't following. On the safe haven side, we'd expect rotation out, instead Utilities and Staples are both rotating in.


CONTEXT

Last week the assets that should rally with ES that make up the CONTEXT model, kept slipping further and further way from ES (ES overvalued, the ES model trading lower), as we start the week, the CONTEXT model is looking even worse. This seems to be more confirmation that traders in other markets than stocks are not feeling very confident in this move from last week.

CONTEXT hitting a lower low on the histogram today as the model diverges from ES even more.

MArket Update-Opening Indications...

If I were smart money right now, I think I'd be wondering what is going on in the EU, not sure if the ECB is just talking up the market or if there's something more there and if there is something more there, how will Germany (the holder of the change purse) react, how far will Germany go. How far can the ECB really go.

I'd also be wondering how perceived ECB policy will effect F_E_D policy, in other words, a lot of things that I don't think the market can truly discount as these are the types of fundamental events that come around every so often and cause everyone to stop and re-think.

So we are going to go slow, look for clues or shifts under way and look at a lot of different assets to see where there might be a clue.

Here's the near term problem, last week Draghi "Talked the market higher", this week he needs to deliver and there seem to quite a few roadblocks along the way. We already see that bond traders are not so confident, the market even right now is not so confident and it looks like last week's trend of underlying trade was not so confident, here's an example (sometimes trends are better than short term charts for analysis in these situations).

SPY short term trends from last week...

 Remember we expected there to be some noise upside, Draghi's comments last week amplified that, but the 2 min trend didn't seem to confirm, it's in leading negative territory, badly.

 As is the 3 min trend.

 And the 5 min trend.

Many of the averages look like this, it doesn't give a lot of confidence in this move up holding.

So we are going to look at intraday indications for now and see what develops, this means from Friday to today, while still keeping an eye on the whole situation.

 DIA 1 min opening is negative

 As is the 2 min

 IWM 1 min opening was negative, it is seeing a little better looking chart, but that hasn't migrated over to the next timeframe.

 IWM 2 min is still in an ugly negative position from the opening.

QQQ slightly negative on the 1 min from the open.

 2 min as well.

 SPY 1 min above and 2 min below are both negative on the open., the 2 min is worse.


I'll be going through a lot of charts early on, although early trade is often deceptive, I think in this case we can expect there to be some real underlying action, gold will be especially interesting.

Overnight and In to the Open

German Finance Minister Schaeble has denied rumors that Spain has requested a full on soveriegn bailout of $300 bn Euros, something we first predicted here the day the $100 bn lifeline for the banks was announced by the Finance Ministers as it subordinated Spanish bond holders and not wanting to get caught in a Greek-like "haircut" on their holdings, they sold them, sending the Spanish 10-year up and over 7.5%, a level that is no where near sustainable. THIS IS the EU's solution causing an even greater problem, the hallmark of almost all EU solutions.

The short selling ban on Italian Financials from last week which was due to expire this Friday has been extended until the 14th of September. For those that remember the last time EU countries put a short selling ban in place, their market tanked despite the ban. Spain's short selling ban from last week is still in place for the next 3 months.

The German Economic Minister warned about large scale bond buying on the back of Draghi's comments of bond buying and talks of a possible rate cut at the ECB. There will be an ECB press conference Thursday so expect a lot of speculation and volatility regarding a potential announcement of the reactivation of the ECB's SMP Bond buying program. We also have the F_E_D / F_O_M_C starting Wednesday and the Bank of England this week.

Escalating the German/ECB divide, a German Coalition member suggested that the German government take legal action against the ECB over the bond buying proposals. The population of Germany is not happy either, especially after comments from Spain that Germany ought to be grateful as they were bailed out after World War 2.

From Reuters:


"The European treaties allow member states to sue the ECB," Hahn, a member of the ruling centre-right coalition in the state of Hesse, told Monday's edition of Die Welt newspaper, adding that Berlin should consider opening a lawsuit against the bank via the European Court of Justice.

"It's time to open the toolbox of the (EU's) Lisbon Treaty and see how one can ensure that the ECB is brought into line to focus on its original task: monetary stability," he said, acknowledging that this would be "an unusual step".

Hahn's comments were in response to a pledge last week by ECB President Mario Draghi that the ECB was ready to fight to save the euro. "Within our mandate, the ECB is ready to do whatever it takes to preserve the euro," Draghi said.

In addition this morning we are seeing the "safe haven" countries see their bonds being bought up (Swiss, Dutch, Finnish and German), while the Italian and Spanish bonds are slipping, apparently not everyone is so convinced the ECB can deliver.

Among them, Moody's:

Alistair Wilson, Moody's: Draghi Reaffirms ECB’s Willingness to Buy Time, but ECB Cannot Resolve Debt Crisis


Last Thursday, Mario Draghi, the President of the European Central Bank (ECB), said that “within [its] mandate, the ECB is ready to do whatever it takes to preserve the euro. And believe me, it will be enough.” The statement lifted market sentiment and sent Spain’s 10-year government bond yields back below 7%.

Media and market commentators have interpreted Mr. Draghi’s remarks as an indication that the ECB is willing to do more to support pressurized euro area sovereigns, for example by expanding the securities markets program (SMP) with further government bond purchases.

In fact, the statement was a supportive but very general one that contained no specific proposals and offered no firmer prospect of the crisis being resolved quickly. It reaffirms our view that the ECB will ultimately do all it can to support policy makers’ efforts to resolve the crisis. However, that is a necessary but not a sufficient condition for the euro area authorities’ current strategy to succeed.


However, the ECB can do no more than buy time: its actions alone will not resolve the debt crisis. Resolution will ultimately rest on achievement of fundamental changes to member states’ budgetary positions and debt stocks, on structural economic changes required to stimulate growth, and on institutional reform to the economic and fiscal governance of the euro area. Each change will take years to accomplish, and support from the ECB will be essential to the preservation of the euro in the meantime.

The timing of Mr. Draghi’s statement is significant. With the July Summit having failed to reassure euro area sovereign investors, and Spanish and Italian government bond yields having risen substantially over recent days, Mr. Draghi’s statement indicates the level of concern among euro area policymakers. It illustrates the extent to which current financial market conditions are credit negative for issuers across the euro area.

Spanish GDP came in at expectations, showing contraction and Euro-zone Confidence numbers have been mixed, there hasn't been much reaction to either.


In Italy...

Italy Auctioned off 3, 5 and 10 year debt, they raised close to the top of the target range, but as would be expected, weaker internals and higher yields

The bottom line, we have a real nasty situation developing between the Northern and Southern EU countries and the ECB, this will be an interesting week and as of right now, the market isn't sure what to do with it.


ACI-Maybe We'll Get a Shot...

ACI has had some major changes in character, although by looking at price alone it may look like volatile chop, look a little deeper and there's a change in character there that's more important than Friday's +29% earnings/dividend announcement move.

I'm hoping ACI will not only give us a shot, but it will come to us on our terms.

 Like UNG, a 5 day chart of ACI shows a clear change in character in ACI, this is what we first saw in UNG long before it turned bullish.

 A 1 day chart shows several possible options, a breakout from a rectangle, perhaps a rounding bottom, maybe a "W" base, there are a lot of possibilities, but I would think based on some of the changes in character, ACI seems like a good candidate to build a larger base which opens up opportunities.

 The 60 min chart show a clear change in character.

 A close up of the 60 min chart shows several accumulation zones, but more interestingly, when ACI went  bit too high on a bounce, there was a negative divergence sending it lower, as if the accumulation/base stage is not over and at lower prices the positive divergences popped up again. Currently we don't have strong reason based on this chart to hope for  reversal, but where 3C stands now, it only needs a turn down and then the probabilities go way up.

 The 3 min chart of recent trade shows a negative divergence bringing price down to lower levels where it was accumulated at better prices, this chart also gives some hope that ACI will turn down once again, that's where we can find opportunity.

 The overall 30 min chart is very bullish, but once again, if 3C turns down soon before making a higher high, we have a good shot.

I'll be watching the 4 day trend channel where the top of the channel is at $7.30, hopefully we'll see a reversal somewhere in that area.