GLD as of last week looked very much like it was going to turn down and perhaps move back to the lower end of a range that "seems" to be building a longer term base for a longer term move to the upside. There are "hints" that there is some enthusiasm in gold today based on the bad Dallas F_E_D print, which in the mind of those who hope for more QE from the F_O_M_C, all economic bad news is good news for further QE and it tends to show up in gold as gold tends to be one of the biggest beneficiaries of QE or dollar debasement.
Let me stress that this is just an initial hint as some enthusiasm in GLD, I believe it would have to show much more to keep it from turning down as it looked like it was setting up to do last week.
The 5 min chart showing GLD in a leading negative position, this would suggest that GLD's very recent 3C movement appears that GLD was preparing for a move to the downside, this is not necessarily bearish if it is accumulated at lower prices as we have seen recently.
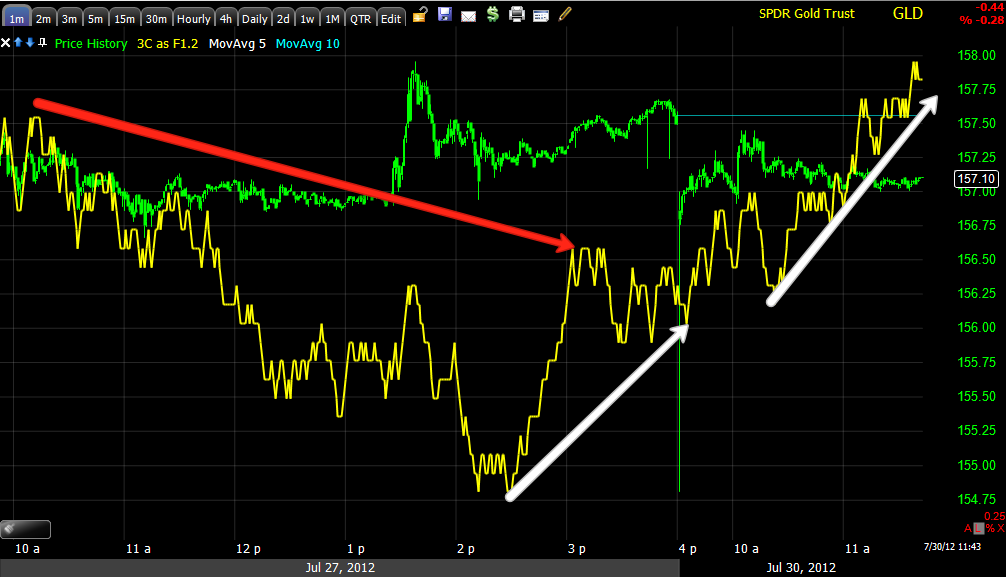
However this morning on a faster 1 min chart, we saw a positive divergence on the open keeping GLD from falling more and since the Dallas F_E_D print, the 1 min chart has moved to a leading positive divergence on the day during a flat trading range (often flat trading ranges are where we see institutional activity).
While this looks interesting, we must keep in mind this is only a 1 min chart and this is a VERY new move, it could be the 1 min positive action is simply keeping GLD in a consolidation position.
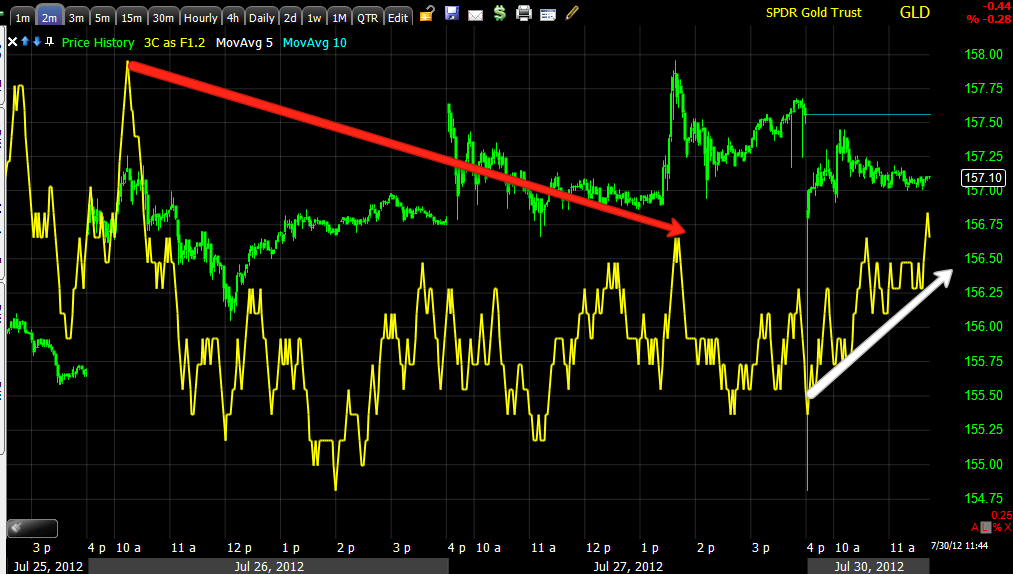
While the overall trend of the 2 min chart also is negative and suggests GLD is about to turn down, we see some of that 1 min positive divergence bleeding through to the 2 min chart on an intraday basis, however, compared to the trend you can see this is very preliminary.

The next timeframe, 3 min IS NOT seeing any of the migration of the 1 min positive divergence, this will be something I'll be looking for and a chart I'll be watching closely. The highest probabilities are still for GLD to pullback, but we do have the start of a new and interesting trend, it's just a start, but worth keeping a close eye on.


No comments:
Post a Comment