Wednesday, August 8, 2012

Risk Asset Update

Most traders look at the market and are moved emotionally and make decisions, come to opinions and conclusions based on intraday trade or trade over a short period of time, like a day or a few days. These same traders also trade in 100 lots. Wall Street/Smart Money/Institutional money has a much different view, a much longer view (we have seen the cycles they set up numerous times), they trade in size most of us can't even contemplate, even the market makers and specialists-forget the HFTs. There's a fundamental disconnect in that issue alone as far as retail traders understanding Wall Street, they trade totally different, they look at the market totally different. To beat the market, you have to understand Wall Street, yo can't do that by watching every tick or daily close, Institutional money thinks in terms of their quarter or year, not their day.

This layout looks at risk assets that "Should" trade with the market (SPX in green is the comparison symbol unless otherwise noted), when there are divergences in these assets, it is a clue or a piece of the puzzle that helps us understand what's going on in the market and where likely reversals will take place or confirm a price trend.
 Since last Thursday (the accumulation day) commodities have tracked the SPX pretty well, if you look at USO and recent resistance it broke above, I think that explains why in part.

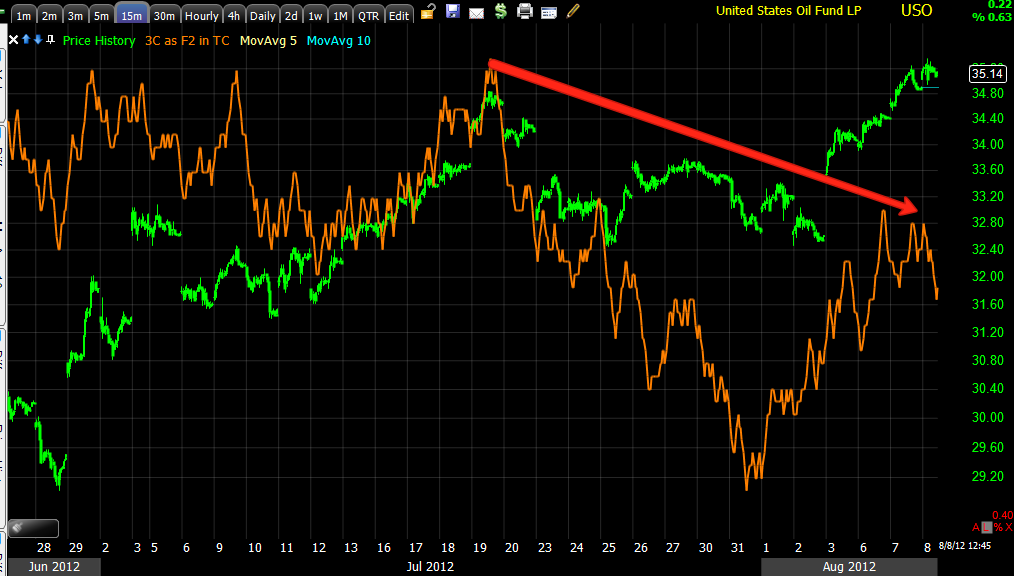
 A longer view shows that commodities as a risk asset have not been excited like stocks have, in fact they are dislocated pretty badly. Typically there is a reversion to the mean.

 The $AUD is one of my favorite currencies as a leading indicator when it diverges with the SPX, it has been in line for a while, just yesterday it negatively diverged for the first time in a long time. Today intraday it seems to be showing a little worse relative momentum.

 The Euro today, what a dislocation, perhaps GS is done selling Euros after their long Euro call last Thursday-the accumulation on Thursday is interesting as well, I doubt it is a coincidence.

 The Euro/SPX which have a positive correlation (the $USD has an inverse correlation) trading together since last Thursday, today the Euro is dislocated for the first time in the trend, interestingly a few days after the market breaks above obvious resistance and the day after the R2K breaks above resistance.

 Credit markets are huge, much bigger than stock markets and they are where the real smart money is, so when a risk asset like High Yield Corporate credit negatively diverges from the SPX, it's time to pay attention. As always, as they say, "Credit leads, stocks follow".

 The same HY credit, which is a VERY liquid form of credit is seen on a longer term, it didn't make a single higher high with the SPX since about the 30th of last month and diverged yesterday and continues to hold that position.

Sector rotation since yesterday, remember last Friday I said "Financials, while showing some underlying weakness, seem to be the sector that is holding the market together". Today Financials are moving out of rotation, Energy is about the same as it was yesterday, Basic Materials (where a lot of momentum stocks are) is stronger today but starting to fade off, Industrials are weaker, Tech is a bit stronger, Discretionary is fading off. As for the "Flight to safety" sectors, Healthcare and Staples are both rotating in today, Utilities not yet.

USO

So far the USO break below the triangle looks confirmed by 3C, BUT, it also JUST broke below that support area we talked about. "If" there was going to be short term accumulation to run the other side of a Crazy Ivan shakeout, the stops that were hit on the move below support would be the supply needed to accumulate to run USO back the other way. I'm talking about short term tactics, I still feel the larger picture is USO moves down, but for options and adding to the position, short term tactics are important.

Here's the volume as support was broken-AGAIN, this is how predictable traders are, put their stops right at support, what market maker/specialist wouldn't hit that stop, it's free money in many ways incl. volume rebates.

This is why we NEVER put stops at obvious places and try to avoid placing them with our brokers in advance as Wall Street can see them, why not play poker and just show them your hand?

USO Update

Watch USO carefully, this may be a Crazy Ivan shakeout...
The intraday triangle and a break below it, if we see a break above, then everyone is being shaken out and we have a Crazy Ivan shakeout, the end result expected would still be a move to the downside after  an upside shakeout.

I just opened the Risk Asset Layout so I don't have 3C open, I'll check USO as soon as I'm done with the Risk Asset Layout and update you if there's anything to see or know.

Market Update

VERY INTERESTING!!! Pop Quiz! Which average has shown the best 3C relative strength the last several days? If you said the IWM/Russell 2000, then yo have been paying attention to the market updates. Bonus question? Why? The answer, IMHO is because the DOW, SPX and NDX all broke ABOVE near by/obvious resistance (on a head fake move you need demand to sell/short in to) and the IWM hasn't made it there yet until yesterday and even at that it wasn't a strong move so it has been a full 2 days behind all the other major averages.

Today I expected to see a lot of intraday volatility with the more important trade later in the day, that's just been the market's behavior lately. If we looked at the SPY, DIA and QQQ alone, you might get the impression the market is just treading water right here and upside volatility would be hard to come by, but as the R2K should always be the leader of a risk on move, it seems the attention is focussed there today in order to create that volatility, you'll see what I mean, but when looking at the IWM charts, make sure to distinguish between the 1, 2 and 3 min intraday timeframes and the 5 min timeframe which is the first of the short timeframes where we see institutional activity.

First the SPY...
 The reason for the SPY first, remember the last post-USO and remember the accumulation on the short term charts from Thursday of last week? Well, here's Thursday of last week, Aug 2nd. Remember also the FB post and why I thought FB would likely pullback and create a larger base rather than make a large run up? The reason why is no matter how strong the accumulation, if it is only 1 day and it's largely confined to intraday charts, they simply can't accumulate a large position and the size of the accumulation is somewhat proportionate to the size of the move, although we have to allow for mark up and possible short selling that shows up as distribution also, but in other words, "if" it was going to be a BIG move, a nice trend up, they'd need a bigger base. This size is perfect to push the averages through resistance, make a quick buck and set up the next cycle.

In any case, the leading negative divergence on the SPY 1 min is much larger than the positive divergence in white, this would suggest short selling in to price strength which is found at a break out above resistance as traders wait for price confirmation before entering, at least many do.

 SPY 1 min intraday with yesterday's negative divergence, trend confirmation at the green arrows, note there's NO positive divergence on even the shortest charts this morning in the SPY. There is a very slight leading positive intraday that could lead to some intraday volatility, but it may be long gone by the time this is posted.

 2 min intraday-again in yellow, no positive divergence intraday at all.

 3 min leading negative intraday yesterday, in yellow no positive divergence even on an intraday timeframe.

 DIA 2 min trend shows 8/2 accumulation and a much larger leading negative divergence since.

 2 min intraday for DIA, there was a small positive divergence on the open sending the DIA in to the gap, then a negative divergence at the highs.

 3 min trend from Thursday's accumulation, note the leading negative trend.

 3 min intraday is almost perfectly in line with price, or confirmation , again there's a small leading positive developing, it's so small it may just be noise, but given the IWM, maybe not.

 DIA 5 min in leading neg. position

 QQQ 1 min with a small positive on the open, that saw a negative/distribution at the highs today

 QQQ 2 min with yesterday's leading negative divergence, today shows no signs of any positive accumulation.

 QQQ 3 min, again leading negative yesterday near the highs and today.

 Here's the QQQ 5 min trend, this is really ugly, a bad leading negative divergence that looks exactly like the move above resistance on Friday has been an area of short selling by institutional money.


Now the IWM
 1 min relative positive intraday followed by a leading positive divergence, this looks like it wants to create some upside volatility.

 2 min isn't nearly as strong so neither is the divergence, but there's still a leading positive right in this area.

 The same that applies to the 2 min applies to the 3 min

Now, pay attention to the 5 min, this is where the signals move beyond intraday and more toward trend, leading negative.

USO Charts

You saw the earlier charts, especially the fact that many or most of the charts are negative in some fashion or another as USO moved above local resistance, lets not forget this move up in USO started with a head fake move/bear trap.

 Here's the bear trap/ head fake move on 6/21-6/28 from a bearish descending triangle consolidation that technical traders expected to break to the downside and then resume the downtrend, it broke to the downside, but was accumulated as short sellers stepped in, they gave smart money the shares to accumulate with their short selling. Now it "appears" we are in a similar bull trap/head fake move (yellow).

On a 60 min chart even the bearish consolidation was being accumulated (white arrow), the break below it which many shorts will wait for as confirmation saw an even stronger positive divergence as it went leading positive on the 25-28th (white box). Now it appears that those shares have all been distributed and most likely in to shorting them as the 60 min chart has a nasty negative divergence at the break above resistance.

 As shown earlier, the 15 min chart as well as the 30 min chart confirm the same.

 On the 5 min, this is why I'm thinking of waiting for better timing before considering an options position as well as perhaps a better entry, we do have a leading negative divergence (red box), but within that an intraday positive relative divergence. The leading divergence (negative) is MUCH stronger than the positive, but it is still a timing issue.

 As shown before, as USO broke above resistance, all of the short term charts' trends went leading negative, the most obvious reason I can think of is the breakout would bring in longs on price/breakout confirmation, their buying provides the demand institutional money needs to sell short in to and at better prices. Also note the accumulation on the 2nd, THAT'S LAST THURSDAY, the same day we saw it market wide, the same day GS put out their "FREE" "buy the Euro" trade rec'd, which means GS has Euros and anything that is risk related to sell, that would explain these leading negative divergences.

 If you look closely, today there's a triangle-like pattern forming, Bollinger Bands (10-min) show the squeeze, a directional move is highly likely, from our experience reversals-no matter what timeframe, see a head fake move about 80% of the time just before the reversal. That would mean we would have such a move on the daily and tactically if we get an upside breakout from the triangle-like intraday pattern, we'd have it intraday as well.

This is what I'd be looking for to start a Put position in USO and add to the equity short...

(1 min chart of the triangle like pattern), a break to the upside with 3C moving to a new low, that would be pretty good confirmation of a false breakout on an intraday timeframe, good timing, an excellent entry for an options position with little risk and high probabilities.

Starting USO Short Position

I'm going to go ahead and start a position short USO. This is about 1/2 a normal position size in the equity model portfolio.

USO Trade May be coming

I'm really not crazy about the way USO looks, even from the earlier EIA post and it is above a very obvious resistance level, this may in fact be a nice bull trap/head fake move worth taking a look at. I'd like to see USO move up a bit more intraday on a negative intraday divergence before entering a position short there.

I may consider a partial position in this area in the equity model portfolio, if I feel timing can be nailed down then I may consider an option position in the options model portfolio.

Charts coming

MCP Adds Another 6.5% Today

We saw something interesting in MCP Monday, many of us took the trade long, I decided to use the equity model portfolio being I wasn't sure what we were dealing with as it developed so fast, yesterday I gave those of you who wanted to stick it out longer, a Trend Channel stop that would guarantee a profit, if you stuck with that stop, you are happy today. I myself, even though admitting there is something much bigger going on, saw some short term stuff I didn't like and took a 2 day 7% profit (no options or leverage).

Here's MCP today...
 Here's the longer term Trend Channel stop from yesterday, now at the $12.35 area.

 This leading 5 min divergence added quite a bit today so something is still going on in MCP, although for me personally being out, I want to wait for a pullback and see what it looks like there.

 The 15 min chart is in a huge leading positive divergence, there was fast and strong accumulation here, something is going on.

 The longer term 60 min chart hasn't seen those strong divergences from the shorter charts migrate to this timeframe, so it seems like at this point, it's still a counter trend/dead cat bounce sort of trade, but I think there's more to what is actually going on than just a dead cat bounce.

 The 1 min chart is showing some deterioration right now with an intraday leading negative divergence, this is likely profit taking as this is at least a 12% move since Monday. Yesterday's negative divergence just created a consolidation (yellow).

This X-Over Screen to avoid false crossovers is what I'll be watching for a pullback to the blue 22 bar (30 min.) average, it may be deeper being we already hit the average once, but I'll be looking for positive divergences in to a pullback and if there are and the longer term charts start seeing positives as well, I'll likely enter MCP again.

If you are still in it, congratulations!

FB Update

We've made the most money doing the exact opposite of what the crowd does, that's why it's called Wolf on Wall Street and not "Sheep on Wall Street". When FB was THE MOST HATED stock, we were making lots of $$$ long, some members had well over 200% gains on calls. You may recall I closed a call position a little early, but still at a good gain and have been PATIENTLY waiting for the trade to come back to us since then, well FB is becoming the most hated stock again and some interesting things have happened.

I almost NEVER get involved with IPO/New issues because of the lock-up period, however there does seem to be something going on. The first day of trade I posted extensive analysis and my general conclusion was GS and MS both lost money trying to defend several price levels, the last of which being $38, that was the working theory when we first noticed something bullish in FB on the last long trade, it may still be a motivation and I wouldn't want to trade against GS anymore than the F_E_D. There may also be issues we don't know about with price and the lock up, this is why we try to follow underlying trade. We don't know what they know, but hopefully we have a good fix on what they are doing.

 In white, this is the area where we noticed something was going on and started buying calls and longs in FB, the yellow area "may" be a short to sub-intermediate term base forming, we'll get to that.


 Here's a closer look, you may recall that I have talked about capitulation days on big volume and a big gap down, I also said that typically the stock tends to drift down a bit in to a base as it moves from the end of stage 4 decline with capitulation and the start of stage 1 accumulation/base. I wouldn't presume to call this capitulation of any particular trend such as primary because there simply isn't enough trading history, but there is a chance we have a base brewing here, thus some of the long/call positions opened recently.

 This 60 min chart shows where we saw some interesting things in FB again and many members made quick $$$ on calls. When we first saw this I mentioned that I don't think this is ready to make a big move as it would be a "V" shaped reversal and those aren't common, I did mention the possibility that it would come back down and form a larger base, that may be what we are seeing.

 The 60 min chart (sorry about the scale) had an amazing leading positive divergence on our first long, you may recall it, now in context it's not even noticeable here, however price is lower and 3C IS NOT, a relative positive divergence on a very important timeframe.

 The 30 min chart and the leading positive from our first long position, also two areas of distribution, I never really got a decent FB position off anywhere in the area because the signals simply weren't strong enough or there. We also have another relative positive divergence between our first long and price now on the 30 min.

 The 15 min chart showing a negative divergence on an afternoon ramp job, but look at the positive divergences since the fall, this is an important timeframe as well. The positive divergence on the 6th seems strange, at first I though maybe it's just noise?


 However here on a 5 min chart we can see 3 positives including the 6th.

 Look at the 2 min trend, again the 6th is showing as positive, that would imply a move quite a bit higher, evn though it all has to be averaged, today is also leading positive on yesterday's decline.

2 min intraday shows positives in the a.m., FB heading higher from there and a leading positive now, this is pretty much how a base often forms, in a range; when it gets too high it is knocked back down and accumulated again, over and over.

 The 1 min trend, again the 6th is positive and today is leading positive as has been the last week or so.

1 min intraday shows a VERY small negative divergence yesterday, confirmation on the way down and a relative positive today and a current leading positive.

I might take a look at FB long stock so I don't have to worry about time decay on options unless I see something that tells me the timing is VERY close. In any case, I think there's more than meets the eye just looking at price in FB.