Monday, September 17, 2012

FB Update

So far all is well and as expected with FB as of last week, the pullback is taking shape which may offer an opportunity for those interested that aren't already in FB (long), of course as always with a pullback, we want to verify accumulation as price reaches their target area. I suppose if you were very nimble and had the time, you could even play the FB pullback with some leverage, however I'd prefer to trade on the side of probabilities and that's not where they are with FB.

 Here's our X-Over Screen, used to weed out false crossover signals. The top window has a simple 10 and 22 bar moving average (yellow and blue respectively), the middle window has a custom indicator which is a series of conditions that must be met and a blue 22 bar moving average of the custom conditional indicator and at the bottom is Wilder's RSI (period 14). For a short signal which we probably had although FB doesn't offer quite enough information to put the moving averages together that far back, the 10 bar crossed below the 22 (for most traders this is where their moving average systems stop and as such see a number of false signals or whipsaws), the yellow custom indicator was likely below the blue moving average and RSI is below the 50 level, those 3 signals together give a short signal. As is the case either short or long, the first pullback is often to the yellow 10-bar moving average as you can see price on the short do at the red arrow. Subsequent pullbacks as the trend develops pullback deeper, by the 2nd or 3rd pullback it is often to the blue 22 bar moving average.

We are VERY close to a long signal now, the custom indicator just needs to cross its moving average which should happen soon, look for a pullback to the yellow 10-bar m.a.

 The Trend Channel has just enough information to create a 1-day channel which is probably a little narrow for a longer trend, but for a swing move, it should be fine. The short is stopped out when price crosses above the lowest level of the upper channel on a closing basis (at the white arrow) and coincidentally the long stop is at the exact same place right now, which is the highest point of the lower channel on a closing basis. I prefer to use the Trend Channel on an established trend, in those situation, it's ability to call the end of a trend is incredible, with newly developing trends, you often need a little more room for the volatility of tops or bottoms.

 We see a head fake move on the open today, there's a gap that may be filled at the white box, if it isn't filled, it becomes a very bullish break-away gap which would hint at a very strong momentum move.

 FB 4 hour chart has a very strong leading positive divergence as well as a positive divergence right where we suspected a base would form and seems to have formed.

 The hourly chart that gave such amazingly strong signals back in June, now makes those signals look almost imperceptible as the much larger and stronger positive divergence forms now.

 Here's the 1 min chart and the immediate distribution of the opening gap higher, as with most reversals the head fake move is usually the first thing to occur.

 The negative divergence for a pullback on the 5 min chart and in fact goes out to about 15 min, not as sharp or large though.

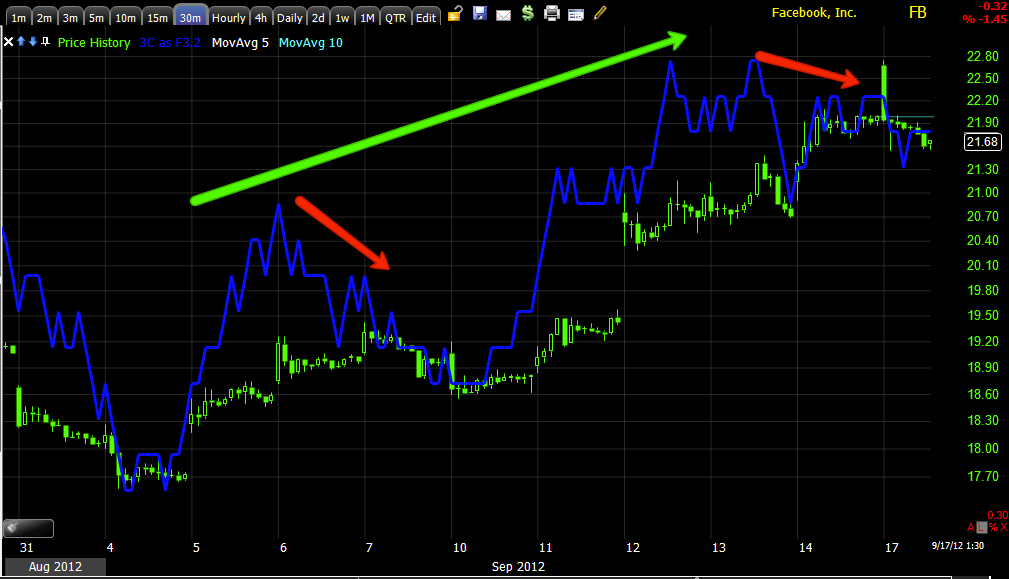
The 30 min chart shows the trend of confirmation with  a couple of small divergences on pullback moves.

I'd be interested in additional or new positions in FB around the $20-$20.50 area.

You might want to set some price alerts.


Gold/GLD

Gold as it turns out, is worth a lot; there's a lot on information to be had in the price action of gold, we simply need some movement to collect it (at least additional evidence).

So far Gold futures and GLD look similar to the market update, some short term positive signals and negative signals on the longer term charts which are almost always more important and give a better picture of what smart money is up to.

There are several possibilities to consider with gold, obviously the strongest correlation is not really even the dollar value any more, it's the inflation outlook so in this sense in many or all ways, gold would seem attractive.

From the information gathered so far, it looks probable that other than intraday jiggles or volatility, gold is looking to pullback. The information most useful there is how underlying trade acts on a gold pullback, smart money rarely chases anything higher so just as QE2 when first introduced saw a 4 day pullback allowing smart money to buy on the cheap, we can get similar information on a gold/GLD pullback.

On the more non-conventional side of things, we might find through the underlying trade that the market or aspects of the market have already priced in QE3 as this is the first of 5 LSAP programs the F_E_D has undertaken in which prices were already elevated as QE was announced (all indications point to the price strength being a direct reflection of QE3 anticipation), all other 4 times the F_O_M_C has used non-conventional policy (QE 1, QE 2, Operation Twist, the extension of Operation Twist) market prices have been depressed, therefore the market had something to be excited about and start moving prices higher to discount the unexpected programs; the only exception would be the ACTUAL announcement of QE2, prices were already higher, but that was because Bernie had clearly telegraphed QE2 was coming at Jackson Hole in 2010. However at Jackson Hole pre-announcement, prices were depressed.

So while it is less likely in gold specifically due to inflationary fears, a pullback would give us additional IMPORTANT information that can only be gathered during a move lower. Without getting too far in to the possible reasons why an already discounted QE3 may not be as positive as conventional wisdom would suggest, is the very same reason gold would appreciate, INFLATION. Remember, Bernie said they wanted to foster maximum employment WITHIN THE CONTEXT OF PRICE STABILITY. In other words, the potential conditionality of QE3 is to be found in what it is best known for creating (not jobs), inflation and there's the catch 22 in a nutshell. To put that in to personal perspective, no one wants to chase prices higher and in to bubble territory and have a sudden halt to the asset purchases until inflation cools; this is sort of like flipping houses during the housing boom, prices of homes have appreciated for years, there's no reason to believe it is coming to an end, but you pay way more than a property would normally be worth to flip it and the music stops.

That's a very simple look at only a few aspects of the possibilities on either side, what we want is to see evidence that changes possibilities in to probabilities.

As to gold futures and GLD, they're not too far off from each other, nor the market for that matter.

 YG (Gold mini Futures) 15 min has the same theme that has been seen in most risk assets since Friday.

 I was a bit hesitant to go out to 30 mins. on the Gold Futures chart because I'm interested in the data recently confirming or not confirming the longer charts and signals in place before last Thursday, but since this chart has given effective signals in the recent past, I thought it was worth publishing.

 Shorter term on the 5 min chart there is in fact a positive relative divergence, much like the rest of the market.

 That can be seen in GLD as well on the1 min chart starting late Friday.


 The 5 min chart also shows a similar signal, although I think this reflects more of the attempt to close the market higher on Friday until the US downgrade spoiled the party.

And GLD out to 10 min which seems to be all fairly new enough information post the F_O_M_C.

A decline would be the next area in which important information regarding the bigger outlook market wide can be collected.

Market Update

I suspect the market is about to shake up this course we've been on since Friday's open with an upside pop, however the information thus far collected since Friday shows a larger probability building of a decent pullback (one bridge at a time as to what that will mean).

 IWM 1 min intraday chart.

 IWM 10 min, very similar to the 5 min.

 QQQ 1 min positive from Friday, but continuing today.

 QQQ 2 min with a much smaller positive divergence within a larger leading negative position.

 QQQ 10 min leading negative also.

 SPY 1 min positiv divergence from Friday and continuing today, we should see some upside from here at least intraday.

 While there's not much in the way of positive signals that have migrated to the 2 min chart

And the SPY 10 min...

Energy, Financials and Tech

Looking a the 3 groups, there's a short term positive intraday divergence, it seems clear that damage was done on Friday primarily to the 5 min charts but that is partly because I'm not looking too far out as I'm trying to get information that is post F_O_M_C, if I look further out, then there's deterioration on longer charts as well like 10-15 min in the industry groups except for 1, you might have guessed, Energy. It seems obvious that Energy is discounting the rapidly deteriorating situation in not only the Muslim world (vis-a-vis sentiment toward the west), but the Chinese/Japanese situation is getting out of hand and probably most importantly is the Armada of 25 nations gathering at the Straits of Hormuz.

 Energy above looks much different than Financials and Tech, the 1 min chart with a fairly long positive divergence in place.

 The 2 min chart also showing some initial deterioration early Friday which sent the sector drifting lower, but that price weakness seems to have been accumulated.

 The 5 min chart shows the same situation as described above, just with a different divergence.
I'd expect Energy to make a move higher shortly.

 Financials are showing a 1 min relative positive divergence, I can't say whether it grows more or not and if it is a simple consolidation divergence sending the group lateral or an intraday move higher, I suspect an intraday move higher probably off some weak dollar catalyst that kick starts energy as well.

 At 2 min on the Financials, there's a small relative positive divergence that migrated from the 1 min chart, but it is within a much larger and stronger leading negative divergence; that doesn't mean financials can't move higher from here intraday, they can, it just means there's likely a cap on the move unless this negative divergence were to improve.

 The 5 min chart, like I mentioned in the BIDU post and also IWM and the other averages, they all pretty much saw similar action on the 5 min chart of a leading negative divergence.

 Tech strangely isn't showing a short term 1 min positive divergence, in fact quite the opposite, it's strange to see these 3 sectors looking so different as they usually all move together as the risk on trifecta.

 Tech 2 min with a leading negative divergence as well from Friday and continuing today.

And there's nothing unique about the 5 min chart here, it looks like many, many charts from Friday.

BIDU Update

BIDU is worth keeping an eye on, it is still a core short equity position and since closing the last Put options position I've just been looking for the next opportunity in BIDU. There's weakness right now, although there hasn't been quite enough strength to make the risk/reward profile enticing. As I said, it's worth keeping an eye on.

 BIDU did make a higher high which interrupts the down trend, I had been hoping to see it stage a stronger bounce to look at it for a new position which I have been waiting on. The gap area in yellow would be decent, but ultimately a stronger higher high above the larger red resistance zone would be more enticing on a risk/reward basis, there may be enough energy in BIDU to make it there; this morning's nearly 1.5% decline is getting close to overdone.

On an hourly chart this is called a "Tower Top", the gap up this a.m. just hit a new bounce high before reversing.

 The 1 min chart with accumulation on the 12th and some distribution late last week.

 2 min chart is similar.

 As is the 3 min chart, but here we start to see a larger positive divergence area suggesting to me that BIDU is capable of moving higher.

 The 5 min BIDU chart.

 A close up of the 5 min chart shows similar action as to what we saw Friday in the averages, for example...

The IWM 5 min chart looks very similar on Friday as did most of the averages. I'm trying to look at data post-F_O_M_C before deciding on whether the larger picture and longer chart data is still valid.

I personally would wait on BIDU and see if it does give an opportunity of lower risk, higher reward and then double check that the probabilities are still lined up toward continued downside momentum.

Opening Indications

There's some short term positives on the charts, for the most part these were formed during the later part of the afternoon Friday when it looked like they'd try to move the market higher in to the close and after the divergences (short term charts) were formed, the market was hit with the U.S. downgrade, apparently crushing the hope of a strong close Friday. Most divergences are simply left over from Friday afternoon.

 DIA with a 1 min positive divergence, most left over from Friday and in line currently.

 DIA 2 min has a slight relative positive divergence in the position 3C is in now, but it hasn't made a definitive turn up yet so this could simply be catching the chart at a "transitory" moment.

 IWM 1 min was positive already in to Friday's close, it is one of the exceptions that has added a bit to the 1 min chart on the positive side.

 No strength beyond 1 min as the 2 min chart continues the negative action seen Friday.

 QQQ 1 min with a left over positive divergence from Friday.

 QQQ 2 min isn't seeing any of that positive positioning migrate.

 SPY 1 min also positive here, but largely as a function of what was already developed from Friday afternoon.

The 2 min SPY chart is pretty much in line with price, (price / trend confirmation).

Latest Stagflation Data

Last week, the week before and now with the only tier 1 US data released today, this week we have more proof of the US economy and specifically manufacturing, going deeply in to stagflation.

The F_E_D Empire State Manufacturing Survey...
Released On 9/17/2012 8:30:00 AM For Sep, 2012
PriorConsensusConsensus RangeActual
General Business Conditions Index - Level-5.85 -2.00 -10.00  to 5.00 -10.41 
Another big headline miss for manufacturing printing at -10.41 on consensus on -2.0 and below even the lowest consensus estimate. Today's print is down from the previous of -5.85 and is the lowest print since April 2009 (notice how all of these surveys and data points are the worst  since the early to mid 2009 era?); this is also the biggest drop in 6 months since the Survey first began keeping records.

As always, the devil is in the details and they point again to the dichotomy in the F_E_D's recently released QE3 policy as the F_E_D can only hope some of these stagflationary numbers (especially on the inflation side) are transitory as they call all rises in inflation. The sub-indicies point to more trouble than just the crushing headline print, for instance the Employment Index dropped from 16.47 to 4.26! As seen in the ISM Manufacuturing data, New Orders dropped hard from -5.5 to -14.03, confirming manufacturing everywhere is losing all demand and existing shipments fell as well. It should be noted the New Orders index was positive until July when it went negative around -2 , so the acceleration is picking up. However it gets worse, Prices Paid (raw materials), just as with the ISM manufacturing Input Costs data, rose from 16.47 to 19.15 confirming not only an accelerating slowdown in manufacturing, but inflationary pressures at the same time which is called "Stagflation".


Pre-Market Futures


European markets have been rangebound and in a consolidation today, you can see via the futures with closing action from Friday at the far left, futures gave up some ground before the European open, in some cases a positive divergence (white arrow) was seen going inn to the European open (green arrow), this still wasn't enough to lift futures to the unchanged mark from Friday's 4 p.m. closing prices (all closing prices are as of 4 p.m. EDT, Friday)


ES is still a few points below Friday's close, there was a positive divergence in to an overnight double bottom, the second of which was at the European open. European markets are said to be rotating out of equities and in to fixed income today with the peripheral markets underperforming the core markets.


NQ (NASDAQ mini-size Futures)-Again a positive divergence at the 3 a.m. EDT European open and a current positive divergence now.

Light Sweet Crude Oil drifted slightly lower overnight, tight now it's seeing a quick move higher to the $99.21 level on a fast change in the EUR/USD.

Gold Futures initially opened higher and lost ground from last Friday's close, now they are about $.20 below break-even with a positive divergence right now.

The EUR/USD since FX markets opened last night, rather flat.

There is this recent move higher in the Euro.

There's no major economic data and volume is expected to be light with the Rosh Hashanah holiday.