Wednesday, November 28, 2012

Going to Open VXX long

It's close enough

Market Update / AAPL

Basically as I was saying earlier this morning, it's rare for a market to lose that much ground that early and just keep going all day and then the next day, like the post I put up last night about different trends/timeframes, shakeouts and counter-trend moves, the market needs to kill quite a bit of time before we are near the close and while it does that, it's going to throw off the most people it can at any one time. This is why we stick with the longer/higher probability trends and see the noise for what it is.

 AAPL 1 min negative, still enough to cause a consolidation rather than a pullback.

 2 min with a relative positive and intraday is in line.

 The bigger picture in AAPL, the 15 min chart leading negative. AAPL has quite a bit of downside in my opinion before this is repaired.

 NASDAQ intraday futures, negative.

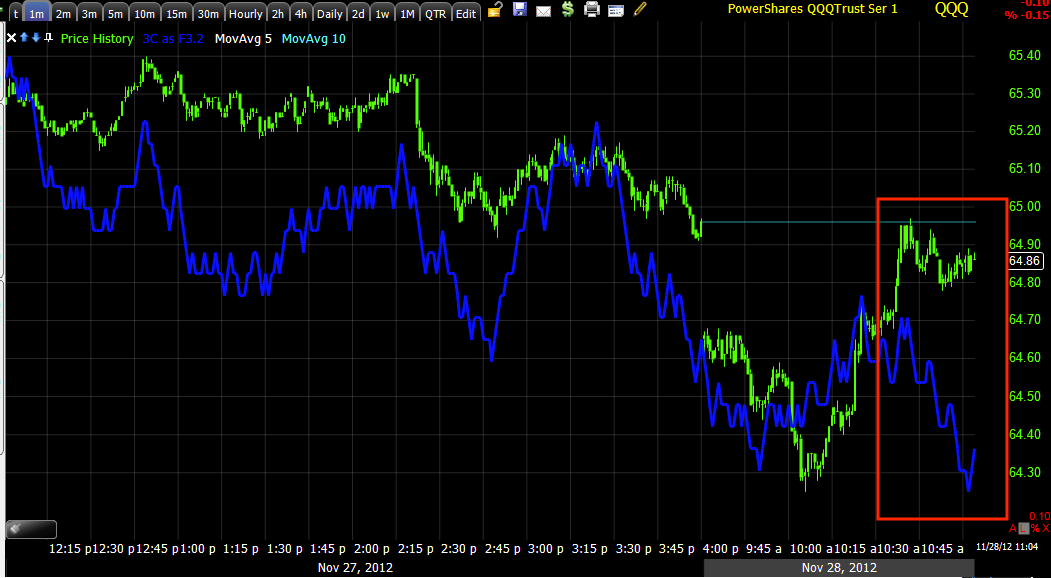
 QQQ 1 min intraday negative

 However that negative hasn't reached the 2 min which is in line or confirmation

 same with the 3 min

 ES 1 min is just starting to see a small negative divergence

 The longer trend on a 30 min chart is very bearish for the days ahead.

 IWM is also negative 1 min intraday


And now on the 2 min so it is starting to migrate.


XIV Long Closed

 That was a decent move of +10% for no leverage.

 The intraday chart allowed me to clean up this position which should have been done earlier in the week.

The longer term probabilities for XIV don't look so good on this 5 min chart, the neg. divergence goes out to 30 min!

I will be looking at VXX and maybe UVXY although I've been burnt there a lot of times, I probably would stick with VXX.

Q's showing the First Divergence

Not surprising since the NASDAQ futures were already showing a negative divergence that the QQQ are the first to show one and along with AAPL, in fact may be because of AAPL.

 QQQ 1 min

AAPL 1 min

So far it hasn't migrated to longer timeframes and this alone could cause a lateral consolidation, if it keeps growing and migrates and the other averages join, then we should see an intraday move back down now that most of the gaps are filled.

EIA Petroleum Report

Here it is from 10:30...

Released On 11/28/2012 10:30:00 AM For wk11/23, 2012
PriorActual
Crude oil inventories (weekly change)-1.5 M barrels-0.3 M barrels
Gasoline (weekly change)-1.5 M barrels3.9 M barrels
Distillates (weekly change)-2.7 M barrels-0.8 M barrels

I wish they provided consensus so there was some context like they do with Natural Gas.

In any case the reaction in USO is difficult to discern from the overall market, the Euro saw a bounce with the market, the $USD saw a milder decline, that would be supportive of oil, but if that' all that oil is hanging on to (legacy arbitrage), then I might be a bit concerned.


 This is USO in green, the Euro in red, obviously the arbitrage effect is moving oil here, it doesn't seem like the EIA report, but we've seen some strange stuff in oil on Wednesdays so I'll keep an eye on it. Right now I don't see any high probability position, that was several days back.

 USO 1 min negative yesterday intraday and at a relative positive divergence this morning.

 The 3 min chart is in line.

The 5 min chart shows a great spot on a head fake move that was in to a negative divergence on the 19th , that was the only real high probability move in USO so I'd be patient and let it develop, let the trade come to you, whichever way that will be. I suspect if there's nothing else moving it other than FX, then it should see downside over the next few days assuming the middle east stays quiet.

Market Update

The TICK is mellowing out big time as the gaps get filled, it's starting to hang around the zero mark, down from +1250. There are no negative 1 min divergences in the averages yet, but they also aren't leading to the upside. AAPL is the weakest of the 1 min charts that mean something, the NASDAQ futures are a close second, ES (S&P futures) are not negative yet, but losing momentum in 3C.

If you were looking for an area to get in to a position that you might have missed yesterday, this is an area to consider, even though we haven't turned negative intraday yet. I was considering VXX which I didn't have an opportunity to look at in time yesterday, but I'll wait a bit longer, keep an eye on the TICK and any new highs in price intraday with TICK failing to match them.

Oh, I'll be closing XIV obviously, this is a good time to do it.

Opening Indications

Here are the early indications in which you will see some early positive divergences and I've included the bigger picture along the lines of the pullback and this is why I say I expect this move down to last more than a morning, more than a day so I wouldn't get worked up about intraday trade, the highest probabilities rest with the longer timeframe charts.

Remember, the last thing Wall St. is going to do is make it easy to make money, just when the market collapsed this morning a bunch of traders who suspected it might, but failed to take action like we did when it mattered (earlier this week) jumped in short this morning and just about as soon as their orders were filled and they were feeling smart (for chasing the market), the market throws them a test of their conviction and the doubt creeps in and so do the BTC orders, we don't chase, we don't take trades on gut feeling and we don't let intraday or even day to day moves shake us off a trade when we see high probability evidence. Emotions are a great reverse indicator, they don't have any place in making unbiased decisions. 

 The DIA 1 min did not quite confirm early on the move down and put in an intraday positive divergence, this was already in place in the pre-market ES chart so it's not surprising, but still this is a 1 min chart-not that it is wrong or doesn't have good signals, it just doesn't carry the probabilities of the next chart.

 The 15 min, which is a significant timeframe for us with a head fake move that saw distribution as it failed and a leading negative divergence, this not only told us today was coming, but that it's going to likely be much worse than what we just saw.

 The IWM 1 min did confirm the gap down and put in a small positive divergence intraday...

 The 10 min going from positive before the 16th to leading negative the last couple of days also points to a move that lasts more than a day.

 QQQ 1 min didn't quite confirm, not surprising for early action.

 The 5 min chart shows the negative divergence, it's along the lines of a multi-day pullback

 But even the QQQ 15 mi n is neg.

 SPY 1 min confirmed this a.m.


 The 10 min chart has a strong leading negative divergence, the FAZ calls should do well, my only concern is volatility.

 Here's the ES 1 min chart posted before the open, a negative divergence after the European open took ES lower and we saw a positive divergence building, again it's early trade so it doesn't mean much other than the intraday signal it is giving.

 The NASDAQ futures were negative all the way out to 15 min after having shown good trend confirmation, so again as I have said all week, I expect this to be an ugly pullback, but it won't be in a straight line, there will be lots of volatility and shakeouts because Wall St. isn't there to make you money, they're there to take it from you.

The TICK -remember it got real nasty yesterday afternoon, this a.m. it was very nasty too, hitting -1400, but shortly after that I saw some +1250 readings.

Just be patient...

Too Early To Hold

I think we'll see some upside pretty soon as part of the a.m. trade, usually declines of this magnitude this early don't hold throughout the day, it may very well close worse, I'm more looking for the next few days though, I'm just saying that it's likely we see intraday volatility to shake traders loose.

There are some early indications that this is probable, I'm capturing the charts now. I'm still keeping put positions open despite any upside volatility, like I said, I'm looking for a move larger than a day.

Here's a Head Fake Move-Did You See It?

One reason many fail to adjust to the market and get fleeced every time, like Technical traders, is because they don't notice the games that are played over and over again and thus they never learn. Here's one game, the head fake which I estimate to be found preceding about 80% of reversals in ALL timeframes, it may even be higher than that. I wrote about this around 8 p.m. Monday night, probably earlier during market hours on Monday too, in fact I did as the triangle had not broken out yet, but for now you can go back to Monday night's explanation of what we were expecting to see on a EUR/USD head fake move here.

The charts...
 Here's the EUR/USD at yesterday's close and now so Reid's comments weren't as horrible as the market suggests, but it's a good excuse.

Here's opening trade in the pair for this week, in orange on Monday we saw this triangle as the Greek issue was being discussed, on the initial resolution (if we can call it that with a serious face) the Euro popped above $1.30 as I said it would in a head fake scenario, this is an important psychological level, it runs the shorts out and pulls the longs in and it's absolutely a part of a strong reversal.

When price moves back below $1.30 and ultimately below the apex of the triangle, longs are at a loss and they start selling which creates a snowball effect as more supply is on the market than demand, coupled with short sellers selling as well that adds even more supply. This gives the initial reversal a boost to get it going and that is one of several important reasons head fake moves are seen so often before reversals, in fact so often they become good timing indicators.

The way you can sum up this concept is a saying from a friend of mine, "From failed moves come fast moves" for all of the reasons I laid out above. There are more reasons why we see these head fake moves and we are lucky that we have an indicator that can help us tell whether it's a head fake move or the real thing, but before the triangle ever broke out i explained how the clearly visible bullish continuation pattern was a perfect set up to take advantage of technical traders that would read it as exactly that.

Pre-Market

Well it's not as early in the week as I thought on Friday, but it does look like the strong confirmation we saw yesterday in a number of assets, but most importantly the short term futures for the VIX as well as Treasuries, finally is bringing about what I think will be a pretty nasty pullback and I use the word loosely, it is only meant to imply that after it is done (with the signals we have now), there should be another move higher. Whether this is a pullback in the true sense of the word or something uglier, I lean toward something uglier.

Overnight ES to me doesn't reflect the drop in the EUR/USD, much is being made of Reid's comments yesterday and they make for a nice catalyst, a nice explanation so CNBC can make viewers feel like they understand why the market acts the way it does, keep everyone complacent, but a lot of the damage came after the European open.

As we sit now, the market is set for a decent gap down, but as always watch out for early volatility and the misdirection of a.m. trade.

 Note ES didn't really drop until a negative divergence right around the European open (green arrow).

 Also the EUR/USD didn't commit to its break lower until just about the same time.

This morning there was a large seller in gold futures around 8:18, a bit interesting.

We have EIA petroleum due out at 10:30 so we'll be watching USO and related assets for any possible trades, this use to be a report that was leaked quite a bit, it hasn't done o as much lately.

Oh and it looks like the SEC is going after SAC's Stevie Cohen, I wonder if that has anything to do with Schapiro's leaving the SEC, after all no one would say the SEC has been zealous about fulfilling their job duties.