Tuesday, December 4, 2012

We should see soon

If the last market update is correct or not, here's an example of the triangle I mentioned in the last update and how the setup works...
 On a 1 min SPY chart we have a clear downtrend, a symmetrical triangle found within a downtrend is considered by traders to be a consolidation/continuation pattern meaning it should break in the direction of the preceding trend and continue lower (typically the target is the distance between the last consolidation and this consolidation). Traders look for confirmation in price to enter trades so a break below the triangle is the confirmation they would look for to short the SPY and volume did pick up right as that happened.

Now the way Wall St. manipulates technical traders because they are so predictable, they run the move down, get the shorts in or the longs to sell on a stop out and then push prices back above the triangle which according to Technical Analysis tells traders it's a failed price pattern and they should reverse their trade, so now you have the shorts covering (adding to demand and pushing prices higher, which causes more shorts to cover) and longs see upside momentum and look to buy (adding more demand and upside pressure). Smart money can use all of this demand to sell or sell short in to at better prices with sufficient demand to move positions the size of theirs.

This doesn't have any bearing on the short term trend, it's just the intraday noise and manipulation of the market and traders, it's just how the game works.


Since the early morning positive divergence in the EUR/USD, it has seen several negative divergences and even the first break to the downside saw a move higher in to another negative divergence, but to traders all they see id the Euro holding up and stocks looking cheap comparatively.

Market Update

Remember earlier I said I wouldn't write off the positive divergences in the short intraday timeframes, well I think we'll see a move on those soon.

 ES is in a leading positive 1 min divergence

As is NASDAQ futures.

The EUR/USD is in a negative divergence, but it just hasn't broken down yet and the market hasn't moved to price in the higher EUR/USD.

I also see a few triangles within the intraday downtrend, they;d make for a good short term bear trap on a break below with a move back above.

I'm not changing any positioning and may find some opportunities in this, but I think probabilities are good for some upside intraday.

UNG Position

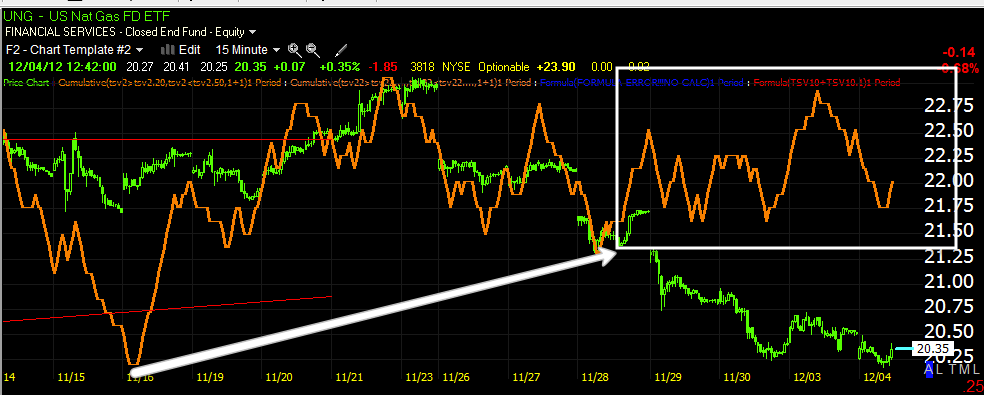
In fact, I think I may add a bit of UNG here (equity long), here's why...

 If this is a sharper reversal, then this area is close to the bottom of the reversal process, also a head fake reversal is a bit sharper than a normal pullback reversal.


 5 min chart

 10 min

15 min

I'm not making a huge commitment here and the risk management (total size and possible add to positions later) is figured first.

I don't think it's much of a risk here.

UNG Update

UNG is one of my favorite LONG term long positions, that's because it has done the work and built a solid base, it is near the breakout / Stage 2 area and it has huge upside potential.

I always hope for the best with stocks like this, that we will get a huge volume spike on an 8% 1-day gain and that attracts retail and kicks off stage 2, but reality is there's a set of concepts and processes that are just part of the market's behavior and we see these at least 80% of the time, probably more. UNG is going through that process now, but the good news is that this part of the process is a marker that precedes the reversal (breakout) we have been waiting for (even though many of us are already at a significant profit in UNG). We have to scale the concept to the size of the base and process to get an idea of timing and we need to make sure there's confirmation (that I'm fairly certain on't be a problem).

For those who never got in UNG and want to or those who want to add, we are near that point, I'll show you what I mean and two possible scenarios that may influence how, if and when you add to UNG long.

 Here's the initial interest he had in UNG long before it created a large base, we suspected it would as there were some large changes in character from volume to the momentum in price. I added ROC (Rate of Change) setting 22 to a normal Wilder's RSI on this 5-day chart and ROC (as I have mentioned many times) improves the RSI signal, it works well on price as well for divergences.

 Here's the base, which as of now looks like a huge ascending triangle (1-day chart), there were a couple of moves above resistance that failed, the last one looks to be a definitive head fake move, not just because of the confirmation, but because of how price reacted and where. While this looks bearish, it most likely is the most bullish thing to happen to UNG in many months. I think the AAPL post last night shows clearly that price action is not always what it seems.

 Here's a close up of the daily, note each head fake move raised volume as prices confirmed it was a false move and both sent price quickly down, "From failed moves come fast moves". The break below the bottom of the triangle also is most likely a head fake move, this one bullish, note how volume picks up on the break of support as stops are hit and shorts places, this creates supply at cheap prices that can be accumulated in the wide open with no one questioning the accumulation.

The fact it happened right here also makes sense as it is near the apex of the triangle so the move to break below the triangle doesn't have to be as large being the high to low at the apex is much smaller.


 Money Stream (weekly) is giving a positive signal here at the base, although i'm not sure we need more confirmation...

 The 4 hour 3C chart is mostly in line with the entire move.


 The hourly is leading positive, ewe do se smaller negatives at head fake areas, especially the last one.

 However what we want to watch for is accumulation in to the move lower, this tells us whether it's a true false move, the 2 min chart has remained leading positive.

 The 5 min chart showing the head fake high and a leading positive divergence as well.

The 10 min chart showing the same things as above

So we have pretty good confirmation this is in fact a head fake move, which puts us that much closer to a real Stage 2/Mark up breakout.

Here's where it gets a bit tricky as far as adding. As I always mention, we rarely see "V" shaped reversals, all of these are a process, the sharpest one was the head fake move. It is possible we have a sharper reversal in UNG, but even at that, I would still expect more of a process to unwind first, more of a "U" shape/lateral move, that's where I'd be looking to add, especially if we get a range with leading positive divergences in the range, from there it should be ready to turn up and once again we will have a failed move lead to a fast move (up) that should have enough velocity to break out of the base.

I'll keep an eye on accumulation, but look for price to start to flatten out, that's where our timing will likely be best. You can always phase in to a position as well so long as the risk management plan is done first before the order.

Market Update

AAPL found support as expected while the S&P and NASDAQ Futures as well as the EUR/USD futures (1 min) are all at a positive 1 min divergence.

Among the averages the divergences are a bit different, the QQQ 1 min positive is there and clear, the SPY less clear and DIA almost non-existient, but this is why I showed the 2 min positives and said not to write them off just yet.

So we'll see how far this intraday move goes and try to keep track of the underlying tone and breadth.

AAPL Update

When adding to AAPL puts Friday the ones already in place were down around 30% or so and I reminded you that this could change in the flash and it has, 2 of the 3 AAPL put positions are at a 30+% gain this morning, this is why I don't let intraday trade bother me and stick with the important signals.

Here's the AAPL update for this morning (I hope you saw last night's as there are several probable trends that will be developing in AAPL, to just assume AAPL will simply continue lower for months on end from here is not what the charts are showing, don't get me wrong, I believe the short term trend  to the downside is just getting under way and there's plenty more, but I also think it will set up at least 1 more long trade and 1 more very large short trade, that's the one I want to be short AAPL stock for the long haul.

This morning's update...
 At the white arrow we have the concept of a bullish reversal candle with increasing volume which makes these much more reliable.  I recently reminded everyone that AAPL's daily chart has done NOTHING for  over a week, except to run some head fake moves.

 Here are the head fake moves, just above resistance which is where traders place limit orders so they can buy at the first hint of a breakout, only to see the positions end the day at a loss. These head fake moves serve several purposes, but one of the important ones for us is that they are an excellent timing marker when we have a divergence and need to narrow down the timing as they usually just precede a reversal and the second is they create more downside momentum in a snow-ball like effect. AAPL has some support at $572.25 so that will be an area to watch.

 The 1 min trend is very clear about these gaps up, they were sold in to and thus confirmed head fake moves. We do have a lower low in 3C at a relative similar low in price vs the 28th, this means 3C is in confirmation of the move lower.

 The 3 min chart which was negative at the head fake break above resistance and then leading negative on yesterday's opening, it is now hitting a new leading negative low. While intraday charts and support may cause some lingering in the area, the longer term charts are deteriorating quickly.

Here's the 10 min chart with a positive at the 16th lows, the range I mentioned with the 2 head fake moves peaking out above it and the overall distribution in AAPL which really picks up around the time of the head fake moves.

I usually like to take options profits quickly, but I think AAPL will offer more so I'll be patient with it.

Keep an eye on the EUR/USD

Again, as it has been for the last several weeks, the market is largely responding to the EUR/USD, as I showed you yesterday in the leading indicators post, the EUR/USD seemed to be the ONLY thing keeping the market from plunging (even though yesterday's 20+ ES point decline is huge and very volatile). The initial volatility in the NASDAQ especially this morning can all be traced back to one place, that is the currency pair or more importantly the US Dollar itself, although fears about the EU are reflected in the pair so it seems to be a better proxy.

 Again the pre-market negative divergence in the EUR/USD...

 The pair responding to that divergence as the Euro breaks the trendline lower and as it does so...

NASDAQ futures plunge hard.

Still I would not discount the 2 min positive intraday divergences I showed in the opening indications post quite yet, but at this point they are really only worthwhile as a tactical tool to enter positions for a downside move, they are not large enough to be tradable.  More importantly I wouldn't forget about the much bigger, much clearer 10-60 min negative divergences in place on all of the averages and getting worse.

We will take a look at leading indicators after the morning trade has burned off.

Last night the dominant Price/Volume Relationship across the board was price down/volume down, which means there is no kind of oversold tension and this is the MOST COMMON dominant relationship during a bear market or bear move.


Opening Indications

So far no big surprises, in fact the pre-market Futures divergences were surprisingly accurate this early. We'll also look at FX and the averages.

 The EUR/USD as shown in the Futures pre-market post (1 min) did see a positive divergence about an hour or two before the European open late last night (actually very early this morning), but by the time the US pre-market was open there was a negative divergence in the pair, which isn't that surprising as I warned and suspected that the move around that triangle yesterday would not be a simple one-way affair, there's too much money to be made by shaking it out both ways and with price so near the apex of the triangle, the distance price needs to travel to shake out both sides is much smaller.

There's some very early weakness in the pair as they seem to be in a sort of H&S intraday top.

 Here's the pair just slipping under the channel that moved above the triangle from yesterday overnight, after first having slipped slightly under it yesterday-thus my warning of a Crazy Ivan shakeout (we have 2 of 3 elements in place now for that to be complete).

 ES futures were very close to being almost perfectly in line, a small positive divergence after the open sent ES briefly higher to new overnight recovery highs, that has started to chop around as the early TICK readings again today are moving more to the volatile side with a +1000 and -1000 move seen already this early in the day.

 NASDAQ futures did have a clear, but small positive divergence pre-market, there was a brief move higher on that before the futures just gave out a few minutes ago to the downside, again on extreme TICK readings.


 DIA 1 min with yesterday's opening negative divergence and in line status the rest of the day.

 There's a slight 2 min positive divergence that I would not discount yet until it is either run over or it is fulfilled.

 I had trouble choosing which longer term chart to use, 10, 15, 30 or even some 60 min charts, all with negative divergences, for the most part I stuck with the 10 min as it is the earliest and I'd want to pay attention to make sure there are no changes or surprises that would hit the 10 min chart first before the longer ones. The DIA is solidly negative for the trend (short term-week/s) despite the 2 min positive above.

 QQQ 1 min shows both the negative divergence on the open yesterday as well as a small positive divergence, again I would not discount this just yet.

 I chose the 15 min QQQ chart because it shows the larger accumulation cycle from mid October to mid-November which will come in to play at some point, but first we do have a negative divergence in place right now to the far right, it is smaller and that is why the trend table reads as it does- Short term trend down, sub-intermediate: up.

 Here's a closer look at the 15 min negative divergence as it is serious, it just gets a bit lost in the bigger picture.

 SPY 1 min negative on the open yesterday and in line the rest of the day.

 SPY 2 min shows the same slight positive divergence, which I wouldn't discount yet, but I also wouldn't ascribe too much importance to it.

The reason I wouldn't give it too much weight is again the 10 min leading negative divergence, there's very little chance that this divergence (which is on longer charts too) goes without any price response and with the size of the divergence, the price response should be quite strong.


SCO (Long) / USO Update

With the Euro up and the $USD down this morning (remember the triangle from yesterday), you might think USO would be higher based on the lower $USD value as crude trades in US Dollars, not quite the case this morning thus far (remember the EIA Petroleum status report is tomorrow at 10:30 a.m.).

Our SCO (2x short crude) is just in the green, near brea even, here are the updated charts that still suggest the near term/short term trend (week/s) is still up for SCO and down for USO (long oil).


SCO (2x short oil) from yesterday gapping down and then filling the gap to break-even like much of the rest of the market (except the opposite with risk assets gapping up and retracing or fading back down)

The USO 10 min chart still shows the same negative divergence in the near term trend that caused us to look at / enter SCO long.

 SCO 10 min still has the same positive divergence as you can see, it lifted SCO off the opening lows yesterday.

 Opening action in USO is positive on the 1 min, which appears we will see at least an effort to make a gap fill, which is what the EUR/USD overnight trade would suggest, it's strange USO opened down like this today with the Dollar down.

SCO is giving the exact opposite opening 1 min intraday signal as it is not confirming the gap up in early trade and also looks to make an effort to fill the gap. I suspect we won't see too much movement either way until the EUR/USD resolves around that triangle and the $1.30 level, but I'll be keeping the SCO long open for the time being.

 USO 2 min this far shows the negative divergence on yesterday's open and so far is in line this morning, whether the 1 min chart will influence the longer charts or just intraday trade (gap fill) remains to be seen, but will be of interest.


SCO for its part on the same timeframe shows the exact opposite as it should, positive late yesterday sending it higher this morning.

My decision to leave the oil short open for now has nothing to do with morning/intraday trade, but is based on the longer term 10 min charts still showing the probabilities are to the downside for oil in the near term trade or short term trend (week/s).

However the currency/oil and even equities relationship is quite odd this morning.


Futures in to the open

Beyond yesterday's 22 point drop from ES highs to lows, the overnight session has been fairly quiet except some movement in the EUR/USD which thus far hasn't been reflected much in the equity index futures.

 Here's the triangle in the EUR/USD from yesterday, we saw an initial slight break lower and I warned not to assume that was the final move, that we may in fact see a Crazy Ivan shakeout (the downside and upside of the triangle) which appears to be what we are seeing so far.


 EUR/USD futures saw a positive divergence last night just before the European open around 1:30 a.m., since a slight negative divergence has set in.

 ES is almost perfectly in line, but compared to the Euro, it's just off its lows and lower than the FX legacy arbitrage correlation would suggest.

NASDAQ futures have a slight positive divergence in to the open.

My early thoughts are that the EUR/USD sees some downside while ES and NQ see some initial upside in trying to reach equilibrium with the currency pair.