Monday, February 4, 2013

The IWM Looks Like the Candidate

As far as the last post goes and short term volatility trades, the IWM looks like it's rotating in to position as the probable leader.

 SPY 1 min

 DIA 1 min


 QQQ 1 min

IWM 1 min-this would be my choice.

Some Weekly Calls?

The TICK chart is improving, the intraday momentum indicators are improving and some 3C charts are improving, I'm not convinced there's a "V" shaped reversal, but I would think we do get some kind of upside reversal today which would be played with weekly calls like the QQQ Thurs.-Fri. trade and a few others last week or there are the 2-3x leveraged ETFs, but remember Reg. T day trading rules if your account isn't Reg. T compliant.

I'd probably prefer to see more rounding before jumping at anything, I'll keep a closer eye on the intraday signals as I'd prefer to buy calls as there's still some downside momentum.

The bigger picture is deteriorating, the volatility itself is a clear hint, just the last of a line of clear clues.

Market Update

Well those multiple timeframe negatives got the best of the SPY and DIA 1 min positive that was building, which from a probabilities standpoint and the strength of each of the timeframes really shouldn't be a surprise.

In the near term ONLY, price is starting to catch own to the 2, 3 and 5 min leading negative divergences to move to a position that is less leading negative and more "in line", that's a slightly better transition, although it's not positive, but it is one step closer.

Guess what else is one-step closer? Continuing volatility, the SPY's gain from Friday of +1.03% has already seen a loss of -.94% so far today, this is certainly volatility picking up and the longer term 2, 3, and 5 min charts are deeply negative.

The EUR/USD still has a 1 min positive divergence, ES is moving toward a 1 min relative positive as is the NASDAQ futures, but you can probably smell the rotting smell of the charts starting to break through the shiny thin veneer of the last month now can't you?

So it's really all about positioning, I'm not fond of taking profits in established shorts on a 1-day move unless they were trades set up in that way.

Early losses like this are usually hard to sustain through the entire day so don't be surprised to see more volatility, but if something breaks here, it's going to be a significant break (meaning if this downside momentum keeps up all day-something has really broken).

I'm going to browse some other indications and opportunities, with this volatility it creates some nice short term opportunities like last week as mentioned last night.


CHK - Chesapeake Energy Work-Up

CHK, while I haven't personally looked at their balance sheet and holding and honestly probably wouldn't be able to dig up a useful opinion about the subject, is well respected for their balance sheet and holdings, the one thing they weren't well respected for was their CEO.

Last week it was announced that the CEO will be leaving as of April first and there appear to be some very big players interested in the stock, although I really hate when they make these things public because there's always a motivation or angle that doesn't quite jibe with what they are saying publicly, this just isn't the nature of Wall Street to tell others what you are doing unless there's some advantage in doing so and with all the different ways to buy/sell/hedge, sell and then buy, buy and then sell and buy again, etc., one never really knows the angle.

So lets forget about that and just focus on what we can observe.

 First off, we have a 5-day chart (this is where I always start to get a feel for the character) and we have a significant change of character that looks like a capitulation event in CHK in the first half of 2012.

First you have to break it before you can rebuild it.

 This is a perfectly shaped and very obvious rounding base formation, at the arrow is the news the CEO will be leaving which sent the stock up in after-hours and on the open the next day-that must not feel too good if you're the CEO. So the question is do we accept CHK for what it looks like right now?

It would seem to me that in true Hedge Fund style (which was lost many years ago), CHK would make an excellent pair trade with a short somewhere in Energy and a long here, but the question remains, right here or?


 The long term 60 min chart shows a relative positive at the left which would be the capitulation event, so there's been buying here for some time, it apparently didn't step up though until the second half of 2012.

One thing you have to consider is the guys involved in buying here, Loeb and Icahn, both have a reputation for being very activity investors, they buy 5% or more of the outstanding and get a big say so or at least they put out a big say so.

 I remember how contentious it was at MOT where one of my best friends was an engineer for the mobile handset division, Icahn wanted to split MOT in to 2 companies more or less, the handset division which was floundering and their more profitable radio (like police radios) division, which eventually happened.

 I went on a rant in one of my classes about MOT and after the class, an elderly gentleman stepped up and told me how much he liked the class and how he was a former CEO of MOT, I was red-faced and apologized, but he said he was the CEO much further back and agreed with everything I had said.

The point being, from the experience of MOT and what was going on inside the company vs. what the news was, employees knew a lot more than what the news was giving out and they knew Icahn was putting enourmous pressure on MOT to break in to two. I very much doubt that the conversations about McClendon leaving the company was new, I suspect it's been an ongoing battle internally between the shareholders/board and people like Icahn and Loeb on one side and the CEO trying to keep his job on the other so accumulation a year back would make some sense, when they could see they were wining the battle, stepping it up later in 2012 makes as much sense, but what now?

 Even the 60 min chart shows there appears to have been some "Sell the news" on the release of the CEO's impending departure, I wonder whether or not there will be an additional pullback and base building? The larger the base, the larger the move CHK can support, I have no problem owning CHK, the question is where?

 On a 2 day X-Over Screen we have a long signal, but we're pretty far from the typical first pullback to the 10-bar yellow average, given a choice, that's where I want to look at owning a larger portion of CHK.

I'd personally use the 5 day Trend Channel for now being there's a lot of volatility in a base, that gives a stop of around $17 so an entry at $18.50 would be delicious.

As of right now, other than some of the longer term trends, I don't see any strong short term signals for a pullback, I suppose you could enter some here with a very right stop, but this is really where retail jumped in, it's not my favorite place to be, a good shakeout and a move lower would be much more appealing.

I do like CHK a lot, especially as part of a long /short pairs trade, I'm not sure which short I'd take yet with Energy, probably long ERY at some point soon, maybe the industry group pulling back will be enough to pressure CHK down, that would be a golden opportunity.

Just remember from the looks of everything, this is a turn-around, a longer term trade so you need to give it space and breathing room, if you aren't comfortable with wider stops in base areas like this than you can always try to chase a stage 2 momentum breakout with a tighter stop, but I'd prefer to be a longer term investor here at lower prices.

I'll watch for short term signals of a pullback.


Opening Indications

The EUR/USD positive that I posted first thing today is positive, but on a very small scale, intraday and that's what I figured would give us the typical morning reversal/bounce off the overnight drift lower, then the opening indications for the averages didn't look so hot, but as I was collecting the charts for this post, at least the 1 min charts in the SPY and DIA started to show more positive activity, at least in the intraday 1 min timeframe, which looks a lot like a gap fill the way things sit now, beyond that though and there's not much for the bulls to celebrate. I'll use the SPY as a larger example as almost every average looks exactly the same, and then I'll show you a chart from each of the other 3 majors just to show you they look the same.

Bottom line, a bounce/Gap fill/ etc. looks likely, the near term charts though are really starting to deteriorate with more momentum like the mid-term charts last week and Friday's seemingly strong market, really wasn't.


 The 1 min positive building since the last post, almost right after...

The 2 min chart showing a leading negative at Friday's highs, there's no strength here at all as of now, so I'd guess gap fill? Unless the 1 min chart can lend some strength to the 2 min or beyond, but we are still talking very weak charts in the easiest timeframe for them to build some strength.

 3 min positive Thursday (reason we went long QQQ weekly calls expiring the next day) and a leading negative divergence in to Friday's price strength.

 And right on down the line to the 5 min chart, which looks worse zoomed out to the trend (below)...


 5 min chart since the accumulation for Trend # 1.

As for a few examples of a few different timeframes on the other major averages...

 DIA leading negative Friday 3 min

 QQQ leading negative Friday 2 min-glad we went with the 1 day expiration rather than something longer.


IWM 5 min leading negative, this isn't a good sign for the timeframe, but especially for the average-the Russell 2000.

Maybe the Euro won't be enough

This is what the EUR/USD looked like last night when I posted it after having opened trade for the week.

 As of last night and below... As of now.

Clearly the Euro lost quite a bit of ground overnight, under Friday's spike low.

We do have a more positive bias in 3C 1 min for the short term, I figured it would pull through on the open, maybe it still will and just needs a little more time, but I'm seeing some disturbingly ugly opening indications which I will post next.

Of course this is making a mountain out of a mole hill this early, but you always have to be prepared for that fast move, the big money on any trend is made about 1 day out of 5 with the rest just noise.

I'll post the opening indications for the averages next.


Would you you rather be Rajoy, Monti, Draghi or the electrical contractor for the SuperDome?

I pick the electrical Contractor for the SuperDome, at least that will pass in a week.

The news is political turmoil is pressuring European markets, but this is all well known by now. What is new is European Investor confidence at 19 month highs as Spain is down 5.7 and Italy down 6.7% as they see the biggest 4-day plunge in the last 6 months, something we saw late last week starting.  The Euro is also down fairly well, about 150 pips.

Guess what preceded the move down in stocks to the worst performance in 6 months on Spanish political and Italian banking scandals? European Credit! I'm sure it's easier for CNBC to just call it all political.

ES and NQ look roughly the same, no big signals there, but there's some slight 3C relief in the EUR/USD, so after a night heading lower in futures, the customary opening bell reversal shouldn't be too surprising, it's what happens in the afternoon that counts, maybe our recent longs from late last week will make some money before things start to turn real ugly.

 ES falling apart after the European open, pretty much in line right now, but...


The EUR/USD has a positive divergence after falling significantly since Friday, that may help risk early on.

Sunday, February 3, 2013

The Week Ahead


Whistling Past the Graveyard

What I'm going to discuss tonight is not so much technical in nature as it is psychological. When I first really dove in to the market during the mid to late 1990's, there were really 3 major forms of analysis, Fundamental which was the primary and just starting give way to the second, Technical and the third which never garnered too much attention, Mass Psychology. I dove in to all of them, but mass psychology didn't have the same tools available in real time as it does now and as I said, never really caught on like the other two.

Something recently has been causing me more concern than I usually have (when I say, “concern” it's not concern for myself, my analysis or my members, I mean for the market in a general way). This week and last, I spoke quite a bit about the Dow 14,000 hype, the way it is portrayed on CNBC in commercials like an action movie trailer, the psychological allure and something I didn't really think we'd see any time soon- retail investors coming back in to the market after more than a year of nearly weekly consecutive outflows. It seems things have changed and at the most basic market behavioral level, there are two simple concepts:

  1. Wall Street and Main Street can't be on the same side of the boat too long in a zero-sum game
  1. You know this one... “What does Wall Street or someone like Dan Loeb who is selling 11 million shares of Yahoo in two days with an incredible 2 cent dspread on the fill NEED to get that done?” The answer of course is demand and it's behind numerous concepts that have served us well in positioning, knowing when and where to position with the highest probabilities and least risk and a whole host of other concepts all tie in to the simple fact that with the size Wall St. sells, they need demand, with the size in which they buy, they need supply and you can figure out what the actual market looks like when demand from dumb money is high and when supply from dumb money is high.

A few weeks ago a site called The Right Side of the Chart  put out a great piece of analysis and went through the painstaking task of taking all the historic AAII data, looking for 18+ bullish/bearish spreads and placed them on a price chart that looked like this...


Last week I told you the AAI Investor sentiment survey, which has had a solid record of bullish and bearish reversals when the survey has an 18 point spread between the Bulls and the Bears (if the bearish sentiment is 18 points higher than the bullish, there has historically been a bottom, when the bullish sentiment is 18 or more points above the bearish sentiment, historically it has been a top). Last week the AAII survey's bullish over bearish sentiment survey had risen to a very high 28 point spread in the bulls favor.

This week the AAII looks like this...

Survey results: 
  Bullish: 48.0%, down 4.3 points
  Neutral: 27.7%, up 4.3 points
  Bearish: 24.3%, unchanged
Long-term averages:
  Bullish: 39.0%
  Neutral: 30.5%
  Bearish: 30.5%

The bearish sentiment remains the same and below the long term average, the bullish sentiment lost 4.3 points and the Neutral gained 4.3 points to leave the survey with a 24 point bullish spread, still well above the historic 18 point spread that has been at market turning points; this is nearly 3 weeks of 18+ point spreads whereas before the spreads were much more moderate.

The sentiment data is interesting, it's helpful, but it's not an exact pin point as extremes in sentiment can last a fair amount of time as was pointed out on the chart above (*Dual buy or sell signals in close proximity often result in major market turns), which is something I find interesting when looking not only at the usual data of 3C charts, the ever widening spread between credit and stocks, but also on my custom DeMark inspired indicator. I've found large sell or buy signals tend to correlate to the size of the reversal. You may recall that the buy signal in the VIX on 1/23 through 1/25 was a beautiful buy on the VIX, however more interesting is the large sell signal in many of the market averages.

The former buy and sell signals on the VIX were accurate with the custom indicator, I warned that the huge Bollinger band volatility (see long red vertical trend lines) which is squeezing, is priming the VIX for a highly directional move. Just based on common sense, there's not a lot of room on the downside for such a large directional move, plus we have the buy signal, but as I was saying and pointed out Friday, the VIX is in a perfect place for a little volatility head fake itself and that' what we saw Friday with a move below the 20 bar average, the market just is predictable in many ways like this.

While the Dow and S&P are better known, those in the know, know the Russell 2000 is one of the most important averages to follow as far as the health of a trend, its performance can tell you a lot about the market that may not be otherwise apparent. Ae have a HUGE sell signal on the same indicator in the R2K, past signals have worked beautifully, I've seen these large signals and they tend to be huge moves. Not only that, but the entire signal takes up just about all of trend #1, as do many of the 3C leading negative divergences, it's very much like Trend #1 is acting as predicted before it even started, as a primer to dovetail in to trend #2, which I'm starting to wonder if this is going to be even bigger than the larger trend we expected.

What may be scarier for those who experienced it during the later half of Q1 2012 as we were setting up 9 core short positions, all of which were sporting double digit returns using no leverage by early June, was the economic data that was coming out with head line beats after being heavily massaged with arbitrary seasonal adjustments, as soon as the seasonal adjustment period ended, the market took a dive to the early June 2012 lows. For ANYONE who was paying attention to the details and not just the headline economic data, it was clear there was major trouble and the headline was a cheap, thin facade masking an economy that was considerably more rotten than the sheeple were being led to believe.

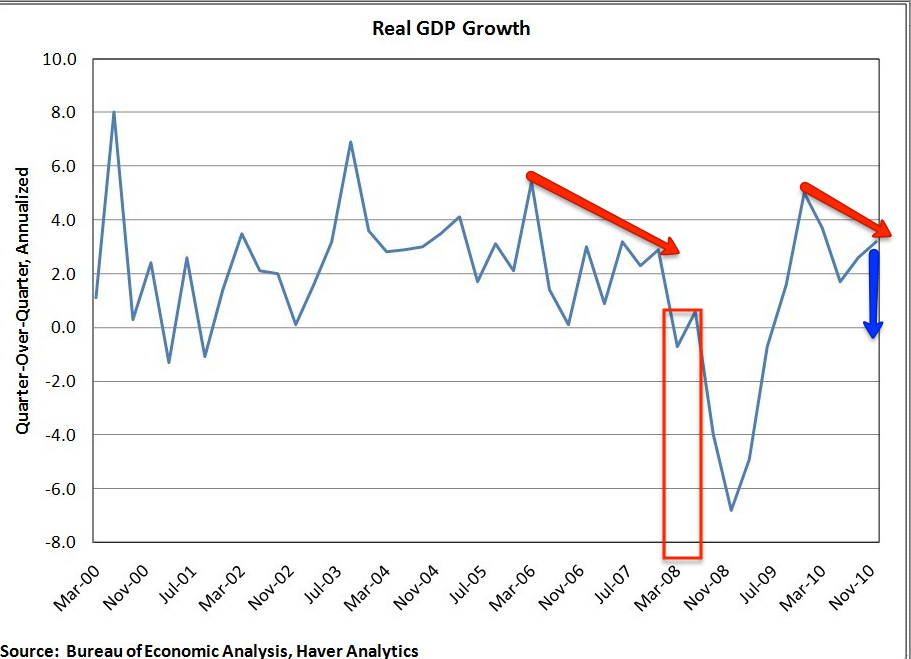
Again we have a similar situation at the same time of year that has even had a few of our members thinking the U.S. economy was improving, of course it's hard to blame them as they are being bombarded with propaganda day and night on the Financial networks that are selling that bill of goods. However if the 4 consecutive regional F_E_D economic activity prints weren't enough to convince you that this propaganda was another thin veneer of subterfuge, then the Q4 GDP that recently came out with a consensus of 1.0 missed even that, which had been lowered from the previous 3.1 because of “Super Storm Sandy”, GDP printed at -.1 to give the U.S the FIRST NEGATIVE GDP PRINT SICE 2009!

The definition of recession is two consecutive quarters of negative GDP prints and it's hard to see how a recession is staved off with government spending about to drop (which accounts for a large part of GDP) and taxes set to go up for 80% of Americans. If there is a saving grace it will likely be that Q4 GDP is revised 0.2% higher so there's no 2 consecutive quarters, but that's just more massaging of data, the point to focus on is the “Improving Economy” being sold can't be improving if we are printing negative GDP and a huge drop at that from +3.1 to -.01 with consensus of +1.0!

GDP just saw the first negative print in 4 years and a lot of downside momentum as it is near the blue arrow I drew in, notice anything similar about the pattern now vs the pattern around the 2007 top?

With all the government had done and kept doing (which will be scaled back very shortly) and the extraordinary F_E_D accommodative policy, this print has to be heart breaking for the kick the can policy makers, after al that stimulus we get the first negative print in 4 years.

If that wasn't bad enough, Germany just printed negative GDP as contagion in the EU finally hit the only and real core, over the next couple of months the market not only has to worry about the periphery of the EU slipping in to a deeper decline (the PIIGS), but the core itself is 1 print away from recession and this as the latest LTRO 2 loan repayment came in at about 1% of what was expected further giving real reason for investors to worry that there really is something still very wrong in the European banking system.

Sometimes you find economic indictions in the most surprising places, but if the German manufacturing powerhouse is truly slipping (as indications are showing right down to port usage), this chart, as odd as it is, tells us something...

This is multi-year so it's not seasonal, this looks a lot more like massive power consumption demand falling, like that of a manufacturing sector, we already know they also have a negative GDP print to everyone's horror.

Then add to that the fears of the US slipping in to recession and the chances of another round of downgrades as Congress makes another mess of the debt ceiling, remember it wasn't so much the US economy as it was Congressional inability to work together last time this topic came up. Now instead of the market rotating between fears over the EU and the US (both of which have been on the back-burner for the last several months other than some political situations), the market may have to worry about both at the same time with North American and European recession, who knows what happens in China- yet dumb money flocks back in to the market, whistling past the graveyard which reminds me of a quote I saw today, “"The wise man does at once what the fool does finally."

While European Confidence Surveys like the German Zew poll show similar attitudes in Europe as here in the U.S., consider the peripheral markets there recently.

The Spanish IBEX saw its biggest weekly drop of -6% in 6 months.


Italy's FTSE MIB Index saw a drop of -3.36% Thursday, another “largest 6 month decline” except in a day.

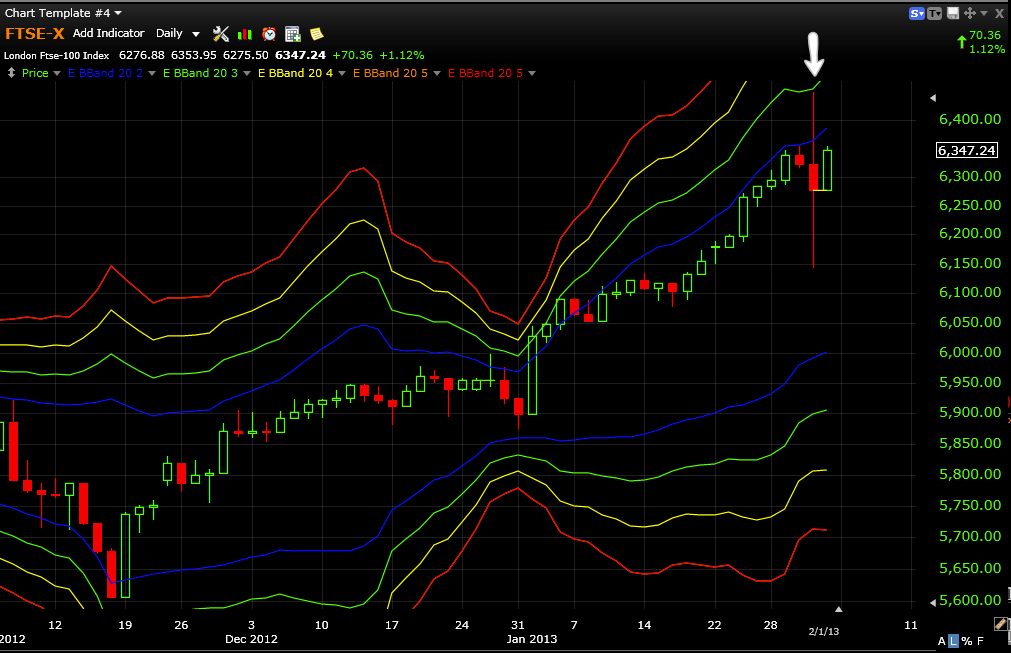
Even the FTSE saw some remarkable volatility that I haven't seen on this chart, hitting a 40/40 Bollinger Band as we work toward the core.

That's a daily chart with huge 1 day volatility hitting a wider Bollinger Band that is hit maybe once or twice a year.

I suppose the point I'm getting at, whether I post 1 sentiment indicator or 10, is that the market behavior that first set up followed by the accumulation to confirm what was predicted as a strong move up, trend #1 which judging from the charts is set to dovetail in to trend #2 (larger, longer and down) coincides with what is becoming more than what I originally thought, it is taking on the shape of a more definitive, larger, more important top and all of the recent subterfuge about the economy getting better, the very low volatility (investor friendly environment) with no pullbacks (making any one feel like they are an absolute genius) is all too neat and organized to lure retail back in to the market which brings us back to the very simple concept of, “What do institutional trades, moving tens of millions, hundreds of millions of shares-whether selling them or building a short position need?” They need demand, they need higher prices, they need someone dumb enough to hold the bag as it is handed off to them.

I mentioned rising volatility last week as it always accompanies turning points, whether up or down and planned on spending a bit of time in this post illustrating the rising volatility (a less investor or dumb money friendly environment, but once you have them in the door emotion and hope will keep them inside for longer than you might think). I'll post this one chart showing trend #1 and the rising volatility and you can keep in mind some of the PIIGS markets while looking at this.

This is showing the volatility during all of Trend #1 moving from 0 to .28 as the high to low range, the last couple of days alone it went from 0 to +.59, more than double the month long range in a day. Why is this important? Not only is volatility a common occurrence before a trend change, but any significant change in character often leads to a change in tend, that's how the whole UNG trade started with us interested in buying it while it was still moving down, it had shown nothing in price, but in other places there were many significant changes in character.

If CNBC was really interested in helping their viewers make money, then they'd explain a chart that is far more important than earnings, P/E's, moving averages or any of that, but I suspect most people's eyes would glaze over...This is one of the scariest charts out there because this is a huge, leveraged market where big money and very smart money plays, if they felt ok about making money in this market, this chart wouldn't look like this...
High Yield Corporate Credit which is a huge, liquid market and credit is traded on massive margin so if the High Yield weren't enough, the size and leverage of the market makes it a playground and choice risk on asset for the smartest of smart money, thus the saying, "Credit leads, equities follow".

The plunge here has taken out the entire trend 1 range other than the first gap up day and did it in 1 week. This is a worrisome chart for the market, but you'd never her about it on CNBC, but I guarantee all the guys on Fast Money and Cramer are watching these charts like hawks.

As for early opening FX and Futures trade...

 The longer term EUR/USD, remember I said "Something is going to have to happen here before we get a really significant move".

 This is opening trade for the FX pair for the week thus far,

 3C stayed very positive at the deep dive and then went negative, since the open for the new week, 3C is in a deep leading negative divergence. This will be an asset of great interest this week.

 SPX futures (ES) opened at the green arrow, it doesn't look like much is going on here on the 1 min chart, but...

 The 5 min chart has guided our 1 day options trades like the QQQ bought Thursday because of the positive divergence and sold Friday for a 50+% 1-day gain, it's leading negative here.

 NASDAQ (NQ) 1 min futures on the open this week look a little more troublesome in 3C.

As does the 5 min chart.

We'll see how the tone of the market looks early this week, if there's significant increases in volatility, then we have some great opportunities for 1 day (give or take) trades like the last QQQ trade except with more potential gains. If things start slipping fast, like the EUR/USD, then it's back up the truck and fill it up.

Here's to a great week, it looks like they just paid the electric bill at the Super-Dome.

Saturday, February 2, 2013

YHOO Sold by Dan Loeb -Third Point

There are some interesting things to learn about market behavior, earnings, institutional activity and more in YHOO's recent trading action.

It was reported late Friday hedge fund icon, Dan Loeb of Third Point sold 15% of his stake in Yahoo, 11 million of 73 million shares over the last 2 days, leaving the firm holding 62 million shares. During those last 2 days YHOO traded +62.5 million shares not including dark pool markets.

The fill on the order ranged from $19.68 to $19.70, assuming an average of $19.69, that's $216,590,000 or about $216.6 million dollars.

What Loeb does is important because as I have demonstrated many times, the hedge fund crowd is not much different than the typical sheep, they flock together for the very simple reason of not wanting to stand out of the crowd which sounds counter-intuitive, but if you are making several million or several hundred million dollars to manage a hedge fund, it's a lot easier to justify underperforming the market with 90% of other funds by a similar margin than it is to be down twice as much as the average fund, the fund manager's first and foremost concern is his or her own survival, keeping that paycheck so few will stray on their own looking to outperform at the risk of underperforming the crowd. It just so happens that Loeb is one of the leaders that other hedge funds follow.

A little about hedge funds, as you might know they aren't available to most people unless you are a Accredited Investor; according to the SEC's Rule 501 of Regulation D, for the average individual to be eligible to participate in a hedge fund as an accredited investor, they must:

Have individual net worth, or joint net worth with the person’s spouse, that exceeds $1 million at the time of the purchase, excluding the value of the primary residence of such person;


  1. income exceeding $200,000 in each of the two most recent years or joint income with a spouse exceeding $300,000 for those years and a reasonable expectation of the same income level in the current year; or
  2. a trust with assets in excess of $5 million, not formed to acquire the securities offered, whose purchases a sophisticated person makes.

In other words, most people don't pass the test. Furthermore, since in their most basic form (there are some ways around this) hedge funds can be formed to allow up to 99 investors or 499 (depending on how they were structured) and as I said, there are ways around this, but the gist is, even if you are an accredited investor, you stand a very low chance of being taken on by some of the more popular funds if you only have $500,000 to invest as they have a limited number of slots available, they'd much rather take on a trust investing $10 million dollars.

Assuming you are part of a hedge fund, the standard fees are 2 and 20, that's a 2% management fee of the mount invested per year to cover normal expenses and another 20% incentive fee, so if the fund makes $100k for you this year, they take $20k of that in incentive fees and the 2% of your AUM.

Some funds charge even higher fees of 3+% and nearly 50% incentive fees, most have a high water mark meaning they don't collect incentive fees until a new high is made for performance, but in many cases the 2% fee of say a $1 billion dollar AUM fund still generates $20 million a year.  

Performance of Hedge Funds...
With approximately 8,000 funds out there, the top 10% have made +30% returns during 2012, 33% have lost money including such notable managers as John Paulson who foresaw the Housing collapse. Paulson's flagship fund lost -17% during the first 10 months of 2012 and an amazing -51% in 2011 which literally effected the price of GLD as investor redemptions had to be funded and GLD was the only profitable position of Paulson's top 5.

The HFRX, widely used measure of Hedge fund industry returns shows the industry returning 3% over  the last year vs the S&P's +18% return, hedge funds are no longer seen as the slick, trendy investment of the rich and famous and many are now turning to their long term track records (when things were better) and trying to sell long term performance. With the exception of 2008 when both fell hard, the S&P has outperformed the H.F. industry for 10 consecutive years.

The leaders...
As mentioned, Loeb's Third point is a leader that many funds follow as well as David Einhorn who has moved the markets by simply giving an interview or voicing an opinion, you may remember him recently as being tied up in the HLF short vs Short Squeeze scenario that kept us away from the trade after some early initial profits. While Einhorn's Greenlight Capital had a double digit return for 2012 that was reduced in December to a year end  +8.6% return on losses in AAPL and gold, another leader, Loeb and Third Point's Ultra fund (which uses significant leverage) gained 33.6% for the year.

Throwing around their clout...
You probably recall the HLF trade, Bill Ackman's Pershing Square Capital very publicly revealed their large HerbaLife short in December which sent the stock down and earned the fund +5.8%, saving their year with a 12.4% gain.

In 2011 Einhorn did the same by revealing in October a large short against Green Mountain Coffee, sending shares down and helping Einhorn end 2011 which his fund spent most of the year in the red, with an end of year +3% gain.

Back to Yahoo..

Obviously these managers use tactics (if you saw the Cramer video none of this is a surprise) like making positions publicly know which is something they'd never do unless it was seen as beneficial, so does this spell trouble for YHOO? Quite possibly, but there are some other interesting things of note about YHOO that I wanted to point out as I talk about them a lot, but it's rare to be able to show you real data that backs up what we know about the market from using 3C and following underlying trade.


 First, here's what YHOO looked like the next day after they posted after-hours earnings, a big gap up and a sell-off. Why? YHOO earnings Beat!

As I remind you again and again, it's not about what you did, it's about the sentiment toward what you'll do moving forward and Yahoo's immediate future guidance was a bit on the lighter than expected side, retail chased the earnings beat, smart money sold the highs as it doesn't look like YHOO is going to top this quarter, at least the soft guidance doesn't inspire confidence and Wall Street is all about sentiment, NOT VALUE.

 As far as Loeb's sales between $19.68 and $19.70, you can see the two days in question have a lot of volume while Loeb was selling, the white trendlines represent the area he was selling in to, check out price action and see where he was selling, also note the very flat price action which I always tell you is where we most often see institutional accumulation or distribution.

 As for YHOO's trend and much of the market is the same, my Trend Channel held the trend up for a $28.5% gain before the Channel gave a stop out. You will NEVER sell at the top with the Trend Channel, but it is not arbitrary, it keeps you in the trend until something changes and self-adjusts to each stock's own personality and recent behavior, when something changes, it stops out and usually for good reason. While the channel would prevent you from selling early and leaving a lot on the table with an arbitrary decision to sell,  you'd have left about 5% on the table assuming you played it pretty well, but this is also the most volatile area, the trend was the easy money.

Here we see the price gain of 32% with the 10-day ATR (average True Range) increasing 42% which it should with higher prices, but as prices got more volatile and crossed below the 20 day average as well as the Trend Channel, the maximum 7.6% gain if you bought at the bottom and sold at the intraday high for the range saw an additional 35% increase in the ATR over the same period, the bottom line, a lot more volatility for far lower gains. This is EXACTLY why I trust the trend channel and take the stop and don't worry about what happens next, the easy money is made, the scraps left over are at much higher risk.

Here we see YHOO and a weekly VWAP (Volume Weighted Average Price). You can see clearly that retail chased prices higher after earnings as they only care about the beat and don't understand it's guidance that really matters, Wall Street may have even helped push the bid/ask up in AH so they could sell during regular hours at much better prices and sell they did (light blue is extended trading, dark blue is regular hours). The next day YHOO fell straight down and remained under selling pressure as it was sold every time it approached the weekly VWAP.

The daily VWAP during the last two days of last week as Loeb was selling averaged around $19.73 the first day and $19.68 the second day. Remember I told you that Specialists on the NYSE and Market Makers o the NASDAQ are often used to fill transactions like these and the VWAP is their target, if they fill better than the VWAP they get additional business, if they fill away from the VWAP, they aren't likely to get repeat business. 


 What seems to be clear on this 60 min 3C chart of YHOO is that there was an inclination toward distribution even before earning and certainly on the gap up the next morning.


As far as Loeb's selling, we see early Thursday what I think is Market Maker accumulation to absorb supply and send prices higher to fill Loeb's order. The Market Maker was obviously given very specific instructions as the order was filled with a TWO CENT SPREAD! That's 11 million shares sold with a 2 cent spread. Do you think you could do the same with just two 100 share orders? No, that's no coincidence.

Final thoughts...
Beyond what I've already clearly laid out, some things to think about?

1) What is Loeb really up to? He still has a sizable position and wouldn't want to knock it down whether  he wants to sell the rest of it or keep it. My gut feel based on the charts is there's going to be a bounce that will be sold in to.

2) As I always mention, it is flat ranges where we most often see institutional activity, these also tend to be the most boring parts of the trading day, but they are when you need to be most alert.

3)The reason they are flat is because orders are being executed and they are as you can see, filled at specific price points, you don't want a lot of volatility a a middle man trying to fill an order at such a specific price and in such large size.

4) The size! Remember how many times I have told you that institutional accumulation and distribution are in large size, they need demand or supply to pull it off, this is why head fake moves are so common, to create that demand or supply needed, it's nothing like us selling a 100 or 1000 share order, we are talking millions of shares, that requires time, patience and manipulation of the market like the head fake moves. I'd bet if Loeb wanted to sell the rest of his position, he's want to do it at higher prices, but maybe he wants to add to his position at lower prices, as Cramer made clear, hedge funds don't do anything "That resembles the truth".

5) Hedge Funds flock, it doesn't matter to us whether they are right or wrong on their entire trade, but if they are all moving in one direction, we want to move in that direction and make money on their flocking, whether they are selling at a loss doesn't matter to us, as long as we can benefit from the direction they are flocking in.

6) Consider my plea for patience, that's your edge over Wall Street, we can turn on a dime and clear out an entire position in minutes, they take days, weeks, months and sometimes years in putting together or selling positions. Think about how our trade size gives us advantages they don't have.

7) Even as Cramer candidly admits, stock prices have nothing to do with value, it's all about sentiment, so sentiment indicators are important to pay attention to like the recent multi-year record long positioning, the recent flocking of dumb money BACK IN TO the market, there are reasons for this, think about how dumb money can be used with headlines such as "Dow 14,000" and think about the strength of trend 1 vs the length and duration of tend 2 and how dumb money and sentiment have recently behaved.

8) look at how price was acting as Loeb's position as liquidated, notice in most cases in the area he was filled, there was intraday demand, something needed to move that amount of shares. In other words, as I always say, "Price is deceiving".

9) Remember changes in trends or character precede changes in trends and volatility is one of the most obvious. Think about how volatility has been extremely low recently and how that's an enticing and friendly market for dumb money to re-enter the market after having been scared out of it, think about volatility increasing now and think about why dumb money might be needed right now and how they created an environment that was very appealing to dumb money.

10) Nothing is as it seems, this is why I follow underlying trade, MACD can be great, but if price is a deception, than every indicator based on price is also deceiving.

11) most amazingly to me is that 11 million shares can be sold in 2 days with a 2 cent spread. As we saw many times the last few weeks, intraday trade is important, the last one was the QQQ weekly contracts (calls) bought Thursday that expired the next day, but because of underlying intraday trade we still made +50% in less than a day.

I'm sure there are good individual lessons for each of you if you just take a look at the chart. I'm already thinking about how a volatility indicator can be a great trend tool and maybe even trading system.


Because I Just Can't Resist and You Need to Know Who's Who in the Zoo

My distaste for CNBC is pretty out there and open, I really don't even know how much I don't like them because the little I see of F_O_M_C days is enough to convince me that I have no business watching or listening lest something said actually climbs in to my subconscious and infects it.

I think the last time I watched Mad Money by accident or laziness (doing something else and was too lazy to go for the TV remote), Jim was going on and on about buying oil (after about a 5 year run and late in Bush II's second term) on the next EIA petroleum report that sent oil down, he termed it as a "Contrarian Trade", which was funny on a couple of levels: 1) Oil was the trade like Gold was the trade during 2010 and 2) Umpteen million CNBC viewers all doing the same thing, the same time in the same asset is contrarian? That same week of late September 2008 and for about a month before, we were calling a top in oil at Trade-Guild.

So I thought I'd publish this rant I picked up from ZH with Cramer giving out some free investing advice (to buy everything Tech) about 1 month before Tech saw the start of the 2000 sell-off-Irony Abounds.

Here's that link

And then there's this one that is a MUST SEE video for a variety of reasons, best summed up by Cramer's own words...  (Watch it while you can, the links are disappearing faster and faster)

Cramer on creating a new truth in order to create a fiction...
" But what’s important when you’re in that hedge fund mode is to not do a thing remotely truthful, because the truth is so against your view that it’s important to create a new truth to develop a fiction. "

Cramer on skirting the laws...
" You can’t create yourself an impression that a stock’s down.  But you do it anyway ‘cause the SEC doesn’t understand it.  That’s the only sense that I would say this is illegal. "

Cramer on using CNBC reporters to spread false information...

"Again, when your company’s in a survival mode it’s really important to defeat Research in Motion.  You get the Pisanis of the world and the people talking about it as if there’s something wrong with RIMM.  Then you would call the Journal and you get the bozo reporter on Research in Motion, and you would feed that Palm’s got a killer it’s gonna give away.
Cramer on whether you can compete on an institutional level without breaking the law...
These are all the things you must do on a day like today.  And if you’re not doing it, maybe you shouldn’t be in the game."

Cramer on how to short AAPL and use false rumors and options to keep AAPL down...
"Again, if I were a short Apple, I would be working very hard today to get that.  The way you would do that is you pick up the phone and you call six trading desks and say, “Listen, I just got off the phone with my contact at Verizon and he has already said, ‘Listen, we’re a Lucky G house.  We’re a Samsung house.  We’re a Motorola house.  There’s no room for Apple.  They want too much.  We’re not gonna let them in.  We’re not gonna let them do what they did to music.’”  I think that’s a very effective way to keep a stock down.
By the way, ‘cause the stock at 84/85 - a little bit a capital you go buy some January 80 puts that makes it look like there’s gonna be something going on.  So maybe give Morgan an order to buy 1,000 Jan 80 puts, and then you go position limit with …maybe you use a hack firm that doesn’t know what the heck its doing – maybe you go to UBS for puts.
You just kinda create an image that there’s gonna be news next week, and that’s gonna frighten everybody –
Cramer on using CNBC reporters to spread lies again...
 They all go out and say, “March put buyer: UBS.”  Then they call Pisani again.  You have to use those guys and say, “Listen, I see a big buyer puts and I’m told that it’s SAC.”  You would do that, too.  These are all what’s really going on under the market that you don’t see."


Interested in the video? You should be, this is the guy who stands for the little guy, but is and forever will be Goldman Sachs Alumni first and foremost, I realized that back in 2008 with the oil trade.