Wednesday, March 20, 2013

Our DE Core Short

DE is one of our core short positions that's in the green, it just saw a downgrade from WFC today from "Market Perform" to "Underperform", of course CAT which is another we like short (although I wouldn't have both unless they were treated as 1 trade for risk management purposes) is taking a sympathy hit.

If you like DE as a short, I don't think it's too late, but I wouldn't chase it here, I'd wait for a bounce to sell / short in to some strength. Our average entry is $88.83.

I do think a gap fill is very possible, maybe even in an F_O_M_C knee-jerk reaction.

 This is the intraday drop in DE which is losing downside momentum, that can open the door for a releif bounce.

 This is the daily chart of DE, today's break was serious at -3.56%, there is a gap though just overhead-if I was looking to add or start a new position, that would be my minimum target area.

 The 3 day trend channel (a lot of room) shows when DE broke the trend at the red arrow, we see the typical volatility after a break.

 Here's where the trouble really is for DE, you can see the 2009 accumulation , but the recent  or last year's distribution has been exceptional to be leading negative on a daily chart and to new multi-year lows, this is why this is more of a core short position which I can be patient with and not be concerned with expirations or time-decay, just let it do it's thing and the past core short positions treated the same way with good entries were double digit (most in the 20+%) gainers within 2 months, I'm looking for a much longer trend here.

 The 4 hour chart which is very important shows the last run of accumulation in August and what looks to be clear selling of those shares in to higher prices and even short selling as we are at a leading negative low below the August 2012 level.

I know DE is not a SEXY stock, but this is one of my favorite short plays for longer term trending.


 the 60 min chart looks to have seen heavy distribution, perhaps someone knew something before the downgrade.

You know the breadth charts I post, like Percentage of stocks above or below their 40-day or 200 day moving average and I've been showing you how more and more stocks have been falling behind as the market moves to new highs or near all time new highs, this is trouble in breadth and a warning flag. This is what it actually looks like other than the breadth indicator charts I post.

Now when I go to look at "% of stocks trading below their 40 day moving average", DE will have joined that group as it broke below the yellow average, even as the Dow itself is near all time highs.

 The 10 min chart also shows the probability of some advance knowledge of trouble in DE as there's sharp distribution at higher prices.

Intraday the 1 min chart is not very positive, this is the weakest relative positive divergence possible, but since the selling is drying up for today thus far, any smart money/large positions will look for a move higher to continue to sell in to, they'll even put some money in to DE to bounce it higher, get buyers interested and sell in to that, it's a small investment that helps out their closing of the position, Cramer talked about this in his manipulation video which is the most honest he has ever been, he's a smart guy, he's just not playing for who he says in my opinion.

Keep an eye on DE to fill the gap, it may be a GREAT opportunity.

$USD Knee Jerk?

There is still remarkably VERY little movement in a lot of short term 3C charts (think the IWM which was nearly perfectly in line as well as the 1 min intraday ES chart), the TICK is in an incredibly narrow range, but one thing I see, that isn't quite making sense is the GLD and USO short term charts.

GLD 1-3 min looks like it's going to make a move, the signals aren't strong enough for me to take a trade like AAPL yesterday and by 5 min there's not much, 10 min negative. USO also has signals that are positive in the 1, 2, 3 maybe even 5 min positive. This suggests to me a move down in the $USD, but short term as these are short term signals.

The only problem is EUR/USD isn't helping identify any FX move, and the single currency futures look negative for the Euro and positive for the $USD. I'm not sure how to take this, perhaps if GLD/USO move and the EUR/USD contradict it and signals go negative, any upside move can be faded. I would think a $USD move wouldn't come until the F_O_M_C so maybe it's part of a knee jerk reaction initially.

This is how hard it is to find any real movement, it looks like the market is VERY unsure of what Bernie will say

Market Update

It looks like there will be a small intraday move to the upside, but it seems to have NO support beyond a 1 min intraday chart.

 DIA 1 min intraday looks positive here for a move up, however...

 Don't forget the 1 min chart's overall or big picture position which is not good.

 And the next timeframe at 2 min has no follow through, 3 min looks bad.

 IWM intraday 1 min is in line

2 min, not so good

 QQQ 1 min is leading positive

 2 min is leading negative, this is why I say a small move, it may even be larger, but it looks to have no support, staying power, etc. It looks to be smoke and mirrors.

SPY 1 min is in line and a bit more negative than that.


Pre- F_O_M_C Very Little Movement

Th SPX is doing what is has been doing since yesterday and following the EUR/USD nearly tick for tick, all the gains were overnight and since pre-market, not much movement in the FX pair or the market or individual stocks...
 The SPY vs the Euro today intraday

Look at the difference between the TICK yesterday and today, there's very little movement in stocks, it seems everything is on hold pre- F_O_M_C

Market Perspective

In last night's post and yesterday afternoon, I showed several assets that looked like near term upside, but that the upside would be difficult to hold.

In fact, the following is directly from last night's post linked above...
_____________________________________________________________

"To me it looks like the market is ready for some early upside, perhaps anticipating the F_O_M_C, but as I said earlier, I would not buy long a new position here.


 The 3 min intraday 3C chart of TLT has a slight negative divergence just like we saw in my earlier post with the market averages, this is confirming.

 At the more important 60 min chart though, there has been a clear flight to safety with this very strong leading positive divergence, this is why I think we can probably sell in to some short term price strength, GOOG for example.

 VXX 3 min shows a short term intraday negative divergence, yet...

The 10 min chart is very strong suggesting a move to the upside that will be faded as money continues to seemingly take the path of safety or risk off.

__________________________
Now, getting back to where we are now.... I would say the signals from late yesterday held up pretty well, early upside, but it's what happens next which seems to be starting to develop now.

This is still early, but volatility is starting to come back from the move up in the market overnight and on the open, 

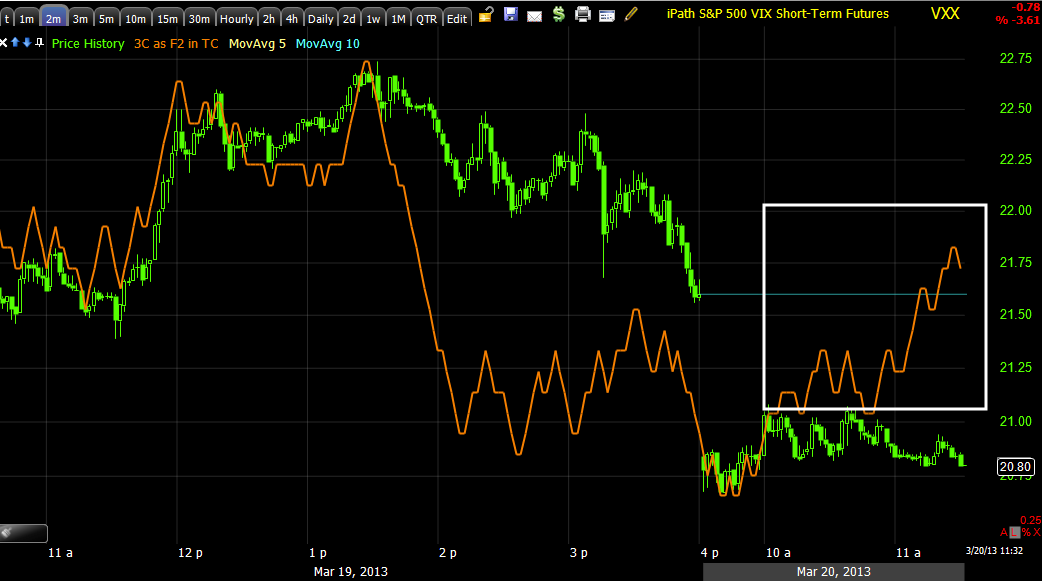
 The short term negative divergence in the VIX with the short term positive divergence in the market averages shown yesterday suggested the short term move would be to the upside, but the more important charts show the opposite, now the VXX and UVXY are starting to go positive, the divergence has to migrate through the longer timeframes and in the case of VXX, reach the 5 min chart, it has a start now at the 2 min chart leading positive.

 TLT was shown as a short term negative yesterday, suggesting the market move up in the near term as you can see above from yesterday's post with the 3 min chart negative, however that is already turning here on the 1 min and migrated to the 3 min chart below.

TLT's 3 min chart.

These were a few of the charts from yesterday that suggested the near term action (as in the open) would be to the upside, but the more important longer term charts suggest it won't hold and we are seeing some of that starting to transform now.

So far, the signals have been right, we'll just have to give them a bit more time and see if they keep progressing in the expected direction that they have already started on.


Opening Indications...

Well, as predicted (not a hard one-actually I couldn't be wrong, price had to move out of the triangle at some point, I guess it could have run higher as Technical Analysis teaches it should) price is falling out of the triangle that has been there since pre-market.

Looking at the opening indications (and I gave it enough time), there's no confirmation of the open for any of the majors except the IWM, perhaps that's part of the reason CONTEXT was looking worse overnight and this morning.

Here are the averages and opening indications.

 This is the DIA with the fastest 1 min chart, which should be able to confirm the gap up if there was underlying strength, in that case 3C would be up where the yellow arrow is, far from it though.

 The Q's didn't confirm either, 3C would have had to make a new high on this chart with price on the open.

 The SPY is actually leading negative here.

 Only the IWM confirmed, it also had a pocket of accumulation at the 1:30 dip yesterday.

Aren't we glad we sold those GLD calls when we did yesterday, momentum and time decay are killers.

Still in a triangle - Video Upload

The market is still in a triangle, I'm guessing we see a break below it at some point as most technical traders expect it to break out to the upside, most likely a break to the upside that fails.

To answer your emails, "Yes, I'm sure there were some voting irregularities" and as for the video, I don't know why it didn't show, here's a second attempt.


In case that doesn't work, here's a YouTube link...


On a Personal Note

Last night we had our yearly board elections as I have served on our associations board for the last year, I received the highest number of votes after living here less than 3 years at 94% of all ballots cast, sounds good right? I just committed to another year of serving on a board for free to deal with nothing but complaints! What was I thinking!

Any way, it was a late night and this video of one of my salt-water aquarium's corals waking up, is about how I felt a bit ago.

Enjoy...

ES CONTEXT

It's way to early to glean much from leading indicators that have just opened, but the continuous CONTEXT model that runs and adjusts all night to shifting markets opening and closing has finally started to break away from risk assets more definitively.

First I want to give you the definition of the CONTEXT model straight from the horse's mouth so you understand how it works, how and when we can identify algo arbitrage activity and essentially just what it all means.

"The world has become an increasingly inter-connected place to trade. Whether due to central bank liquidity or the shortening of business cycles, asset-classes tend to behave in highly correlated ways most of the time. The CONTEXT framework attempts to distill the world’s ‘risk’ asset-classes (interest-rates and curves, credit risk, FX carry, commodities, and precious metals) into a single-measure that can be judged against the US equity market in order to comprehend potential mis-pricings (or technical flows and liquidity impacts). Institutional and algorithmic clients tend to use CONTEXT as a confirmation tool for positioning against (or with) a trend."

Now this morning's CONTEXT chart...
The current differential between the model (green) and ES (red) is -5.91 points, earlier it had hit sub -9. 

The point is, when we do look at leading indicators and risk assets such as credit and rates later as those markets adjust to opening trade, I'd expect to see some dispersion that we have not seen in recent days, but that's just conjecture at the moment until we actually look.


Pre-Market

Overnight the EUR/USd that the market tracked so closely yesterday saw an overnight move to the upside...
 EUR/USD overnight

 EUR/USD 1 min 3C chart with a negative divergence.

This alone was enough to lift futures, it didn't hurt either though that the Yen fell in overnight trade as you saw the Yen's influence on the market in last night's post.

Single Currency Yen future fall overnight taking the EUR/JPY and USD/JPY both higher.

Stock Index futures have seen ES and NQ (SPX and NDX futures) surge to their highs for the week this morning look like this right now...

 ES hits the highs of this week's trade with 3C confirmation, but a small triangle consolidation right now.

 NQ futures also at their highs with a current consolidation, but much less than confirmation from 3C.

R2K futures missed their high of the week, 3C doesn't loo good here as it too consolidates in a triangle.

The apparent reason for the overnight surge? We talked about the probability yesterday, it seems overnight the Cypriot Finance Minister who resigned, but didn't went to Russia as planned and held talks, saying, "We are hoping for a good outcome, but really cannot predict".

The entire ramp was based apparently on the word "hope" alone as discussions have produced nothing concrete yet, other than to seemingly try to force the EU's hand by involving the Russians in a bailout and strategic natural gas development project just off-shore.

As for reality, the Spanish PM said Spain will have to cut their economic outlook yet again.

Before the Bell Fed-Ex cut EPS as well as their Cap-ex, may ground aircraft, yet they are considering a 10 million share buyback-talk about subterfuge, how about spending that money on growth?

Then the EU rumor mill started up, first with

""Kathimerini Cyprus reported that an agreement has been reached in principle for Russian investors to buy Cyprus Popular Bank (Laiki) in a deal that would reduce Cyprus' funding needs by 4 billion euros."

Then as usual with,
"CYPRUS GOVERNMENT SPOKESMAN DENIES REPORTS OF DEAL TO SELL CYPRUS POPULAR BANK CPBC.CY TO RUSSIAN INVESTORS."

If you can't ramp the market on hope, then go for rumors that you know not to be true.