In last night's post and yesterday afternoon, I showed several assets that looked like near term upside, but that the upside would be difficult to hold.
In fact, the following is directly from last night's post linked above...
_____________________________________________________________
"
To me it looks like the market is ready for some early upside, perhaps anticipating the F_O_M_C, but as I said earlier, I would not buy long a new position here.
The 3 min intraday 3C chart of TLT has a slight negative divergence just like we saw in my earlier post with the market averages, this is confirming.
At the more important 60 min chart though, there has been a clear flight to safety with this very strong leading positive divergence, this is why I think we can probably sell in to some short term price strength, GOOG for example.
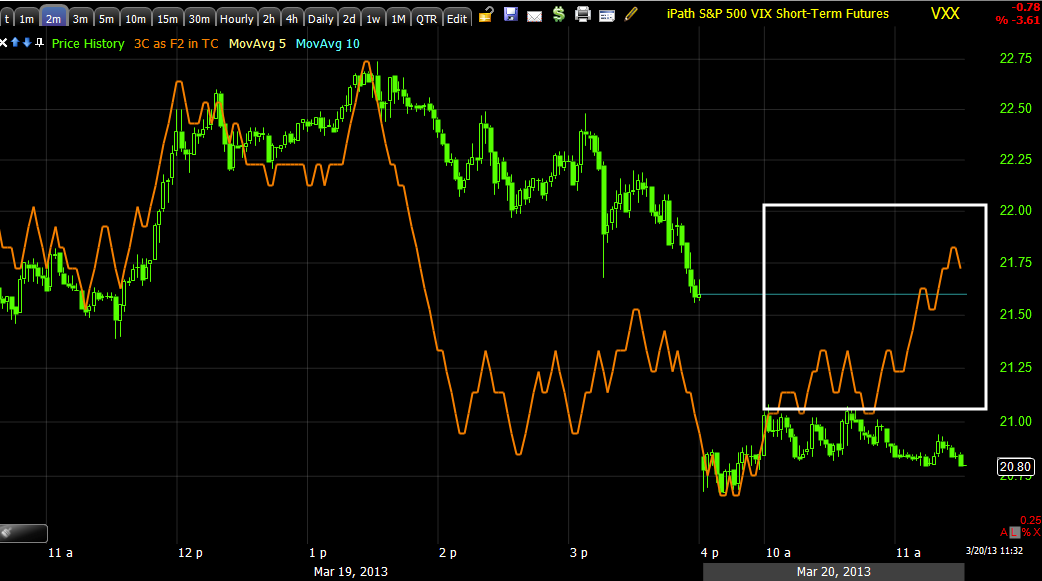
VXX 3 min shows a short term intraday negative divergence, yet...
The 10 min chart is very strong suggesting a move to the upside that will be faded as money continues to seemingly take the path of safety or risk off.
__________________________
Now, getting back to where we are now.... I would say the signals from late yesterday held up pretty well, early upside, but it's what happens next which seems to be starting to develop now.
This is still early, but volatility is starting to come back from the move up in the market overnight and on the open,
The short term negative divergence in the VIX with the short term positive divergence in the market averages shown yesterday suggested the short term move would be to the upside, but the more important charts show the opposite, now the VXX and UVXY are starting to go positive, the divergence has to migrate through the longer timeframes and in the case of VXX, reach the 5 min chart, it has a start now at the 2 min chart leading positive.
TLT was shown as a short term negative yesterday, suggesting the market move up in the near term as you can see above from yesterday's post with the 3 min chart negative, however that is already turning here on the 1 min and migrated to the 3 min chart below.
TLT's 3 min chart.
These were a few of the charts from yesterday that suggested the near term action (as in the open) would be to the upside, but the more important longer term charts suggest it won't hold and we are seeing some of that starting to transform now.
So far, the signals have been right, we'll just have to give them a bit more time and see if they keep progressing in the expected direction that they have already started on.


No comments:
Post a Comment