Tuesday, April 9, 2013

Leading Indicators and Levers

On the whole, I'd say most risk assets are generally supportive, there's a pretty large disconnect between the SPY arbitrage and SPY movement and the SPY Arbitrage model and the CONTEXT model; SPY arbitrage is supportive and based on the assets it uses I can see why, CONTEXT's model is much less so.

 SPY arbitrage model is positive, but only by $.30

 ES model is negative by as much as negative 8 points.

I can see where some of the SPY Arb. levers are being used and thus the model is positive, I'll show you.

 Commodities overall as a risk asset are supportive, I don't know how much is risk appetite and how much is $USD weakness (arbitrage).

 Look at known SPY lever HYG (High  Yield Corp. Credit), HYG is not only leading the SPY on the day, but compared to previous record highs in the SPY, HYG is outperforming or darn close.

 Even High Yield Credit which is not part of the model and much less liquid is supportive at new highs above the SPX's previous highs last week.

 The short term VIX Futures are another known SPY lever and they are hitting new lows on this chart, yet the SPY has not hit new highs so that lever is obviously being used (VIX Futures).

 The $USD is broadly supportive of risk, whether commodity or equities as it is down quite a bit. There's little doubt this has a good part to play in the GLD/SLV move today.

 The Euro as you might expect is also supportive, but at a new high vs the SPX's former high last week, so extra support there.

 And the $AUD is supportive as well.

 Yields have been broadly supportive recently, there's a little stickiness this morning, but they are certainly not pulling down on the market much.

Sector relative performance is not what I expected (generically-as far as Tech I know what AAPL looks like ). The safe haven sectors like Healthcare, Staples and Utilities are down  as expected, well as would be expected from a day like yesterday. Financials are up as expected as is energy and the momentum stocks in Basic Materials, however Industrials, Tech and Discretionary are not playing along very well.

I'll show you the averages and futures next.

Looking to Maybe Add a Weekly SPY, DIA, QQQ or IWM Put

This is along the lines of the 1 day trades, open today, close tomorrow.

There are plenty of negative signals in the averages as well (more importantly) on the 5 min futures charts, the 1 min futures charts are what have me waiting.

I'll update them in just a few minutes, I want to check leading indicators also.

SLV / GLD Follow Up

Last night I posted about the COT short squeeze probability in Silver, this morning around 10:15 we saw a pretty parabolic move up in both PMs, this is why I wanted leveraged ETFs rather than options, there's less draw down, less maintenance needed and I can leave the positions alone and let them move rather than worry about loss of momentum, pullbacks, being in right on time for the move, etc. so we went with 2x leveraged longs.

At first I thought it was $USD related, if it is, it's not EUR/USD related, that pair didn't really move until at least  30 mins later, but there's some movement higher in the Yen about the same time, the $USD is a little later and the USD/JPY doesn't look quite right.

The move itself does look like the start of a short squeeze so that's possible, although the volume is a bit higher than usual for a short squeeze.

The charts...
SLV

1 min is in line and positive late last week when we picked these up.

 2 min is positive through late last week when we picked these up and leading positive right now


5 min is positive and confirming, if not leading.

 The 15 min chart is in a very positive position for a longer move, there's no confirmation, but I wouldn't expect it to catch up that fast on a 15 min chart.

GLD
 The GLD short term charts look very different, the 1 min looks like distribution in to the move.

 As does the 2 min

 And the 3 min so there are signs of migration, I would take the charts seriously, but it's still intraday timeframes.

 The 5 min is close to in line, but actually a bit negative-again migration.

 This is why I really liked GLD, the leading 15 min so I'm not so sure I want to give up on GLD for a longer term move, that is why I chose the leveraged ETFs over options.

 The 15 min chart shows what often happens, price moves to or above the level in which accumulation first started.

 As for stops, these are a bit together than I like for the longer term trends, but maybe they are worthwhile in considering trying to re-enter at a better price if they are broken, SLV's 30 min 50/bar m.a. at $26.20 and the Trend Channel at $26.35. The 30 min seems to track the trend better in SLV

A partial position sale is also a possibility.

GLD's 5 min 50 bar ma is $151.60 and the Trend Channel is 151.76. This is a 60 min chart which has held the trend better than a 30 mn.

As for the leveraged positions, the stops are as follows:


AGQ (2x long silver) 30 min 50 bar ma and Trend Channel
$34.53  for both.

DGP (and UGL) both with the 60 min 50 bar and Trend Channel $45.60 / $45.05
UGL $74.90 / 73.90

Again for short term trading these are probably good stops, I do like the chances though of a longer term trend in both.

SLV and GLD Update

If you are long either one, you are probably aware of the parabolic price move intraday to the upside.

Personally I think SLV looks a lot better than GLD short term on this move, I would consider taking some profits or at least having a trailing stop with GLD. SLV I feel a little better about, but I'm not a fan of parabolic moves so depending on your leverage and how nimble you are, what you risk tolerance is, you might consider a trailing stop for SLV too, I'll probably just hold SLV as an open position for now

AAPL Still Not Ready

Yesterday in this post, "Waiting On AAPL" I could clearly see the potential the trade has as a long, not a trend reversal, but a counter trend move which can be stronger than bull market moves.

However as I wrote yesterday,

"I may miss the position, but I'm not taking it until the 1 min chart looks the way it should. If this were an equity long, I'd probably take it, but timing is so much more important with options, especially weeklies."

This is for some, the hardest part about trading, at least at some point in your career. Our biggest edge over Wall Street (especially the mutual funds) is that we don't have to be in the market all of the time, we can open or close a position with one trade instead of taking days, weeks and even months. Our edge is summed up in one word, "Patience", the ability to pick and choose our fights and for any military commander, the ability to pick the time and place of your fight is a huge edge that can overcome all sorts of odds stacked up against you.

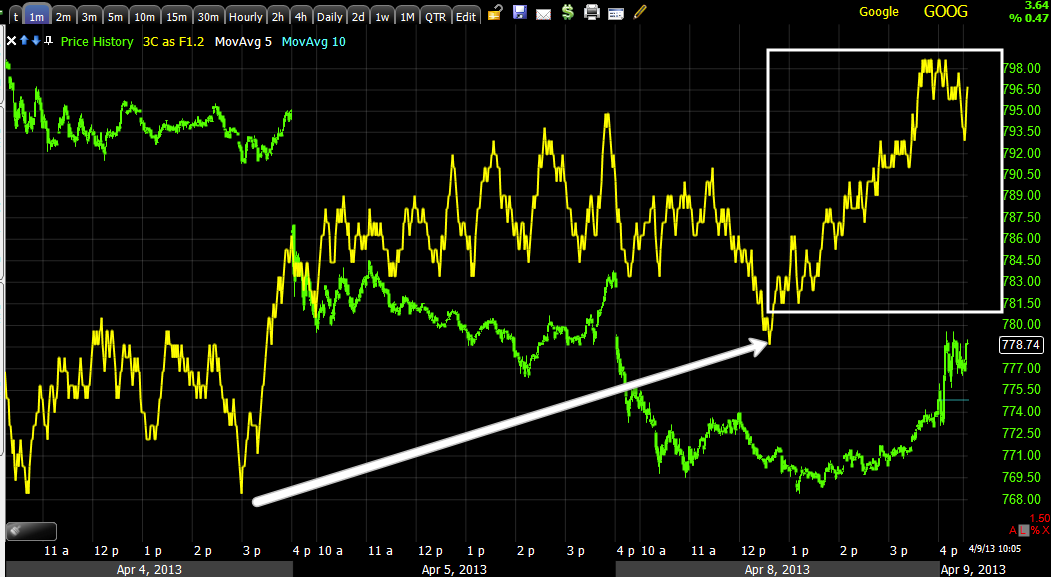
Remembering what GOOG looks like (and as far as my decision, I don't even care of GOOG goes straight down from here, I would make the same decision every time when the probabilities align like that),  note the difference in the AAPL charts and this is a position I think has a lot of potential if it can just make the connection.

 Like GOOG, the 15 min chart has done the work, it looks great, but the shorter timeframes that are more along the lines of timing are problematic.

 The 10 min chart looks pretty good

However at the 5 min chart, it went from looking good and being on course to heading down the last day or so and that weakness is not coming from the longer timeframes, it's feeding up from the shorter timeframes as divergences migrate through higher timeframes-good or bad.


 So at the 1 min, there was some good action, but as I said yesterday, I'd rather miss the trade than take it with this chart looking like this and it's not just the 1 min as its nearby weakness is feeding up the timeframes.


 The 2 min chart showed some promise, but then tracked with price lower

 The 3 min chart did the same, looked good in a few areas, but tracked lower instead of showing accumulation in to lower prices, it showed confirmation of the tend lower.

I doubt the weakness on the intraday timeframes will spill over to the 15 min chart and ruin it, but for now, I can't see the edge in AAPL. 3C is meant to give u an edge, if we don't demand that edge and take sub-par trades, what's the point?

Even the 5 min momentum indicator shows no trend of bullish behavior at all, compare to GOOG even though GOOG's price action may have been weaker, the underlying action was clearly stronger and that's where the edge is.

GOOG Charts

While the rest of the market yesterday was a hollow, volume-less, vacuum tube driven ramp-a-thon, GOOG as noted in several posts and an add-to position was doing the work I had hoped to see the market do.

Here are the charts, we'll compare to AAPL in a bit because I like AAPL, I'm just not sure I'm, or rather AAPL is ready. As for GOOG...
 GOOG 15 min is the important chart showing the larger flows of underlying trade, the work here was done and it was more a matter of timing, the shorter charts to connect with the longer 15 min.

 The last couple of days GOOG did exactly that, the 1 min chart with a solid divergence off a perfect area of bearish sentiment with the gap and low followed by a rounding bottom.

 This migrated as it should to the next chart at 2 mins leading positive

 Which migrated to the 3 min chart

 The to the 5 min showing we had a solid divergence.

 And finally the 10 min chart makes the connection with the 15 min, all timeframes in line and positive.

 The intraday 5 min / 50 bar that so many traders watch saw volume on even the slightest peak above the 50-bar and as it broke higher with the 50 turning up, volume followed, the Trend Channel moved in the direction of the Trend and has held the move thus far.

 Intraday 5 min momentum indicators are all positive

Even at 15 min they are all positive, we just need to see Stochastics embed above +75/80

Loving GOOG Here

Yesterday it did the work or rather completed it, this is still a decent area I believe at least for equity longs, calls may be a bit expensive.

Futures

First currencies...
 USD/JPY is about in line 1 min

 EUR/USD is looking a bit parabolic and has some slight 3C weakness.

 The Yen also has some slight weakness, but most currencies have only slight wekness.

 The 5 min Yen chart seems to have been right all along, however we'd have no way of knowing why until this morning.

 Euro 1 min has slight weakness on that last parabolic run

 Euro 5 min is close to in line with slight weakness on the last run up

 USD has some slight strength

USD 5 min also slight strength.

Stock Indes Futures
 ES 1 min with a positive divergence turning ES up right at the European open, some weakness going in to the US open.

 The ES 5 min chart is the kind of chart I'd play a 1-day weekly put on typically.

 NQ 1 min also slightly weak

 NQ 5 min the type I'd play a put on for a day's move

 YG/Dow 1 min looks the best as it did in 3C yesterday

Still the 5 min is weak.

Gold and Oil
 Crude 5 min looks to see some downside


Gold 5 min and gold seems to want to pullback a bit more as mentioned yesterday

Up, down, up, down...

You probably wou;ldn't be surprised if today's gap up or seeming gap up finishes down, after all, it would make 15 days in a row of this SPX see-saw action.
Today as the 15th dy would be due for a gap up open and a close down.

Furthermore, from yesterday's closing report...
"You can probably guess what today's dominant Price/Volume Relationship was, if you said Close Up/Volume Down, you are correct, this is not the relationship between the averages, but among all component stocks in each of the averages, it was very dominant, this is the most bearish of the 4 correlations and suggests a 1-day overbought condition which most typically sees the next day close down, which would fit with a 15th day of up down in the SPX."

Every day that I can recall that I have posted a dominant P/V relationship that bears some short term relationship like 1-day overbought or oversold, has called the next day perfectly, at least I can't remember the last time it hasn't.

As for the Yen last night and other currency moves...just loo at Bitcoin go, how long before the Central Banks and their agencies that do the dirty work launch a global campaign to close down Bitcoin, perhaps using Chinese Hackers, although I suspect the Chinese are quite happy with n appreciating currency. Any form of wealth like gold or solver is not liked by Fiat-based central banks which is an oxymoron, just look at what happened to the Liberty Dollar here in the U.S.

It seems the initial dust-up in the Yen sending the USD/JPY carry trade lower (not typical for recent days) was a planned set of statements by various Japanese officials and those close to the Central Bank, it seems they feel 100:1 is the perfect rate for the USD/JPY, so the Yen strengthened on those statements, I think it has more to do with China and the BOJ fearing they lost control as JGB futures were on the verge of a 3rd day in a row of limit down circuit breakers.

As for the market, as I said yesterday, "I don't trust this move", it didn't do the work so I wouldn't be surprised for the market to take some back, unless we have another day of "Lowest volume of the year" (excluding holidays) so the algos can ramp the market again.

The EUR/USD is in a range of sorts between $1.30 and $1.3060. There's a little futures weakness in the Euro single currency, but nothing out of hand and a spot of strength in the Dollar Index, again, nothing very spectacular. The Yen has gained a bit since the USD/JPY high of $99.65 last night right around the time of the Japanese statements on the USD/JPY's appropriate level of $100 and has seen the Yen strengthen since, with the USD/JPY now lower at $98.93. This is slightly market negative as the Carry trade is effected, whatever carry is left.

As for the futures, they are coming up in the next post.