While the rest of the market yesterday was a hollow, volume-less, vacuum tube driven ramp-a-thon, GOOG as noted in several posts and an add-to position was doing the work I had hoped to see the market do.
Here are the charts, we'll compare to AAPL in a bit because I like AAPL, I'm just not sure I'm, or rather AAPL is ready. As for GOOG...
GOOG 15 min is the important chart showing the larger flows of underlying trade, the work here was done and it was more a matter of timing, the shorter charts to connect with the longer 15 min.
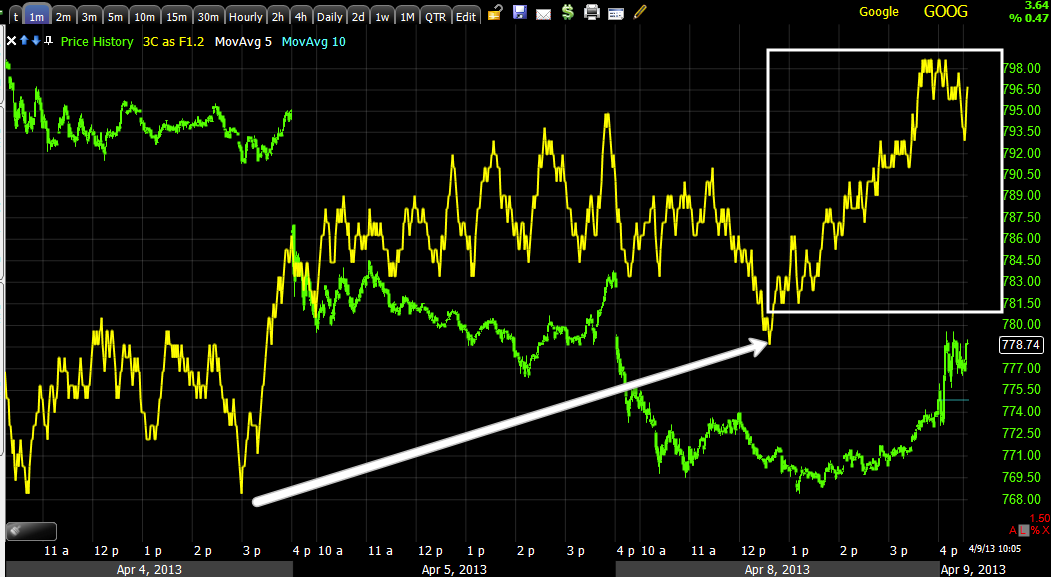
The last couple of days GOOG did exactly that, the 1 min chart with a solid divergence off a perfect area of bearish sentiment with the gap and low followed by a rounding bottom.
This migrated as it should to the next chart at 2 mins leading positive
Which migrated to the 3 min chart
The to the 5 min showing we had a solid divergence.
And finally the 10 min chart makes the connection with the 15 min, all timeframes in line and positive.
The intraday 5 min / 50 bar that so many traders watch saw volume on even the slightest peak above the 50-bar and as it broke higher with the 50 turning up, volume followed, the Trend Channel moved in the direction of the Trend and has held the move thus far.
Intraday 5 min momentum indicators are all positive
Even at 15 min they are all positive, we just need to see Stochastics embed above +75/80


 | Theme by Thur
No comments:
Post a Comment