Tuesday, April 16, 2013

TLT, VXX and HYG & ES / $USDX VWAP

As mentioned and shown in a previous post, the SPY arbitrage (as well as CONTEXT for ES) do not appear to be showing any upside manipulation in the market, there very well may be downside manipulation or this may be natural trade (although I suspect Wall St. would like to see the market pullback as much as I would).

 SPY ARbitrage is negative as it was earlier so it seems pretty clear whatever drove the $USD down and the $EUR up or the EUR/USD up, was responsible for moving risk assets as well. I'm still not sure what moved the pairs, but something did and it was supportive of market risk as seen in the market moving higher intraday.

The SPY Arb model is even lower now just minutes after capturing this one.

The 3 Levers -These are the 3 assets that are actually used in Capital Context's SPY Arbitrage model, they consist of Flight to safety or safe have flows via TLT, Volatility and as such either Fear or Greed through the VIX futures VXX and institutional risk appetite via the risk asset of  choice, High Yield Credit via HYG.

So even before the SPY Arbitrage model can pick up the underlying flow of funds, here are the 3C charts confirming my thoughts.

TLT -20+ year Treasuries
 The intraday 1 min chart is leading negative, there is a gap (yellow) that likely will be filled, to do that the market would likely have to pullback in to the area of yesterday's lows to continue its base, this would be all around good for us in taking on high probability, but short term trades. In other words, whether manipulation of TLT or not (I suspect it is), it "appears" there's a short term move away from safety and toward risk and 3C is showing the probability of a further pullback-if the market can stay in a range and accumulate while this happens, it will be very bullish for a short term move up.


 TLT 3 min chart shows the accumulation, rotation in to safe haven assets (Treasuries) right before the market move, today we see more short term distribution suggesting more downside and a short term market move higher.

 VXX shows the accumulation mentioned last week after we saw real demand as VXX WOULD NOT move lower despite a higher SPX as protection in options was being bid heavily. The next trading day was yesterday so smart money was prepared as we saw as of Thursday. Short term we have a negative divergence moving VXX lower and suggesting more short term lows which suggests the market make a move higher short term.


 XIV is the inverse, but it confirms the same as the VXX 1 min chart above.

 VXX 5 min accumulation before Monday's plunge in the market and a head fake move (yellow) before the downside reversal, this chart is in line.

 Longer term 15 min VXX is leading positive, this is in sync with our slightly longer expectations of a sharp market move lower after a short term move higher.

 XIV 15 min is the inverse of VXX and it confirms the VXX 15 min chart PERFECTLY.

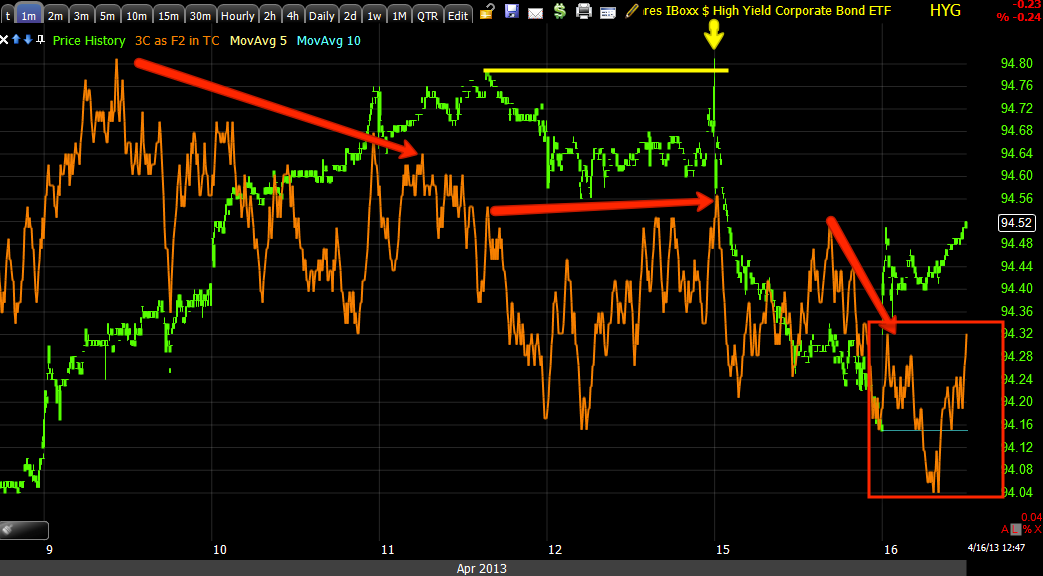
 HYG1 min went negative as the market was topping last week, it also made a head fake moce (yellow) remember we see these moves quite often just before a reversal so seeing one can often be a good timing clue.  The move up in HYG intraday is not supported by 3C as SPY Arb suggests, this suggests short term HYG come down and by correlation, the market as well to base more.

 HYG 2 min shows the same distribution at the top-same time as the market. It also shows a leading negative divergence now, suggesting HYG comes down short term which has a strong correlation with the market.


HYG 5 min is the longer term and just as we see accumulation in the longer term (5 min) market averages, HYG confirms, suggesting we do see a bounce or short term move higher.

 This is ES 1 min at the top of the VWAP band, this is exactly where middle men filling orders like market makers on the NASDAQ and specialists on the NYSE strive to sell or sell short, the green areas are where they want to buy, so again even VWAP suggests the market pullback.

 As does the 1 min ES intraday chart, leading negative. Remember all of the currency moves and divergences at 5 a.m. this morning, ES has a positive intraday divergence right there, which is also at the bottom of VWAP, the buying area.

 $USDX 1 min VWAP at the sell area, the white is the buy area, the green arrow is 5 a.m. when $USDX was at the buy of lower VWAP channel, we saw this in today's first futures post.

And 1 min $USDX accumulation at 5 a.m. and a leading negative divergence since.

I would not chase prices here, you may want to consider taking profits or having a trailing stop on short term long trades that some of you took yesterday, otherwise I'd be patient and wait for the market to not only pullback, but to accumulate and that is our signal to start taking on some short term trading positions.

If that does not happen, I'd still be patient and if the market continues higher, we'd just wait for decent prices, heavy distribution (which is not present on the 5 min charts now) and then start setting up the bigger picture short entries in to market strength.

Quick Market Update

The Index futures intraday (all 3) are turning even more sharply negative intraday, the market averages are negative, although some not quite as negative as the Index Futures, still enough and the $USDX actually looks like it may be putting in the divergence needed to send it higher and the market lower, the Euro already has a sharp negative.

So look for the pullback to begin anytime now in earnest.

Futures Update

All of the intraday 1 min Index Futures have negative divergences as well.

 ES 1 min negative

 NQ 1 min negative

TF 1 min negative.

The 5 min charts are positive as I'd expect them to be, but it seems smart money wants the market to pullback just as much as I do.

 SPY ARbitrage is negative so it doesn't seem the market is being tickled up by anyone, I believe it is directly related to currencies and it seems something abrupt happened, some fundamental news that was instantly discounted.

Last time I looked at CONTEXT it was just a fraction of a point from turning negative, now it's about 3 points negative, which means it's more or less in line with ES, just signaling the same pullback I've been expecting.

I'll loo around a bit more.

Intraday Market Strength Via the $USD

As I suspected Friday (and long before) and wrote about extensively this weekend. currencies have a lot more power right now than you might think.

Something happened with the $USD, that is what appears to be moving the market, I don't know what, but it seems VERY sudden.

or it could be something in the Euro as it spiked up and the USDX moves opposite the Euro as the Euro makes up 50% of the $US dollar Index. The $AUD and Yen moved as well, but I don't think they sparked it, it seems they are drafting through correlation.

So, not sure what moved them, but it supported the market.

SPY arbitrage is negative so it seems smart money does want the market to pullback so they can accumulate.


There are intraday negatives in the SPY, QQQ and DIA so I expect they will back off soon and continue on the pullback course.

Market Update Charts...

First, if you saw or review the charts in the "Pre-Market Futures-Last Night Told the Story" Update, then none of the trading action thus far or the charts I'm going to show you will come as a surprise.

In fact, if you saw any number of posts yesterday on the type of base I expected before a move up and the pre-requisites or standards for a tradable base (vs one I'd rather just sit out), than no price action thus far is surprising.

First, assuming you saw last night's Futures Update  as well as "The Daily Wrap"  and the "Few More Things " post that came after the Wrap, again none of these charts will surprise you, in fact you should be expecting a move toward further consolidation. In fact, after a quick search, I referred to a "W" , "U-shaped" or "Rectangle-base " at least a dozen times yesterday and specifically said that "I would NOT buy anything that I thought would not have a sufficient enough base to produce a reliable move,  I do NOT want to buy a DEAD-DAT bounce as they are highly unpredictable and unstable" and that I thought it would take at least a day and a half to 2 days of accumulation at minimum to produce a sufficient base to even consider. 

This is demonstrated most efficiently with 3 SPY charts.

 3C SPY charts
 This is a 5 min RELATIVE POSITIVE divergence, it is relative because we are looking at two points and the difference between 3C and price at those two relative points represented by the left side of the white arrow (*white is for positive divergences, red is for negative divergences and green is "in line" or "3C / price trend confirmation"*) and the right side of the white arrow.

You will notice that price is lower at the right side, but 3C is higher, this is a relative positive divergence between 2 relative points. A leading positive divergence is stronger and this is when 3C leads price, this typically develops after a relative divergence.

So we have the start of a positive divergence, in this case that can be less selling as price moves lower (and we are talking about the underlying trend or institutional money, not retail) or actual accumulation of lower prices which is typical of accumulation. In either case, whether smart money is looking to sell at higher prices and more than likely looking to sell short in to higher prices.

The short term 1 min chart does not represent the underlying trend of larger money flows, it represents intraday moves and in this case it is not confirming the gap up at the time of capture which leaves us with a negative divergence intraday and suggests lower prices. *Since capturing this chart (as the 1 min chart moves fast) prices have dropped a bit as expected and there's the start of some intraday accumulation.

The idea is that at very minimum, the gap up today in the smallest "W" base, would represent the middle high of the "W" and the next move would be a pullback to the last low of the "W" before moving higher to a breakout and that is in the case of a single small "W" base as I have drawn in above with arrows.

Now looking more specifically at intraday currency movements and the resulting Index Futures movements, we will see the same thing proposed last night and shown this morning in the pre-market post which suggested there would be an early pullback today as the more important 5 or 15 min charts have positive divergences like the SPY 5 min above and the 1 min intraday charts like the SPY 1 min above tell us the highest probabilities are for an intraday pullback which allows us to continue building a more reliable base.

Remember it takes time to capture and post these so the charts may have changed a little by now, but the concept is what is important.

Currency Charts (1 min intraday)...

(Please recall that the Euro and $AUD tend to move with the market so a pullback signal in either suggests a pullback in the market. The Yen and $USD tend to move inversely or the opposite of the market so strength in either currency or signals suggesting strength should produce a pullback or intraday price weakness in the market averages. Weakness or signals suggesting weakness in the $USD or Yen suggest strength (underlying accumulation or price moves) in risk assets like the averages as well as commodities like Gold, Silver and oil).

 $AUD 1 min intraday signals a leading negative divergence and a pullback in the $AUD.

 $Euro 1 min has the exact same signal as the $AUD, both suggesting early price weakness in the market averages.

 $USD positive intraday divergence suggests higher $USD prices

Yen 1 min intraday has the same signal, both suggesting risk assets see intraday weakness or a pullback, all 4 currency charts confirm each other and all suggest early price weakness in the market averages.

We already know that the 1 min SPY chart above agrees with all 4 of these charts as there was a 1 min negative intraday divergence suggesting SPY, early downside such as we saw already.

Market Index Futures... We should see negative divergences in all of the following on the intraday 1 min charts to confirm every chart seen above from SPY to Yen.

 ES 1 min intraday negative divergence

 NQ 1 min intraday negative divergence

 TF 1 min intraday negative divergence.

All 3 Market Index Futures, the SPX, NDX and R2K respectively all confirm EVERY CHATT ABOVE.

Other risk assets like Gold and Silver should at least confirm the $USD currency chart on an intraday basis.

 YG (Gold Futures) 1 min intraday negative confirms the $USD and risk assets generally as seen above.

SI/Silver Futures 1 min intraday leading negative divergence also confirm what gold and the $USD show as well as the risk assets (market averages above).

On an intraday basis, EVERY SINGLE CURRENCY, Market average, Index Futures and Gold/Silver ALL confirm each other.

As mentioned above in this notation right under the SPY 1 min chart  "*Since capturing this chart (as the 1 min chart moves fast) prices have dropped a bit as expected and there's the start of some intraday accumulation."  and here's the results of that...
The SPY 1 min intraday divergence I mentioned that was moving toward the positive and prices following.

As of now the 2, 3, and 5 min SPY charts are all positive suggesting more upside. ES, NQ and TF futures 1 min charts are still in leading negative position, but improving, their 5 min charts are still positive as they should be. So far this should lead to more upside, but I'd hope that this is an intraday shakeout and we return to a basing pattern.

All of the intraday currencies suggest we will pullback shortly as of now.


Quick Market Update

Charts will follow, but this is exactly what I expected, not only yesterday in talking about what kind of base I'd like to see "W", rather than a "V" reversal which would be a dead cat bounce up today, but it fits with last night's posts, especially the futures and PERFECTLY with this morning's pre-market posts.

I see some more pullback coming, but it's absolutely of ZERO concern to me, it's what I wanted to see.

I'll show you the charts next, but just to let you know about the early action, it seems to be right on track and positive for us making some money on an upside move as well as being able to short in to that upside move for the larger downtrend which is already under way.

Did you know in the average bear market decline there are just about as many (if not more) days that close up than down? Yet the bear market continues to move down as the down days are much larger. Also counter trend rallies in a bear market are some of the most powerful rallies you'll ever see.

I'll also be updating the PMs as well as UNG which is interesting as well.

Pre-Market Futures Last Night Told the Story

I'm not even very concerned with news from last night, although there were some notable events, but the reason why is some currencies that needed to moves, that my post last night suggested would move, went ahead and moved despite economic news that would normally not only keep them from making the move, but would have sent them in the opposite direction.

In essence, what needed to happen in currencies to help the market happened, even if the news would have otherwise prevented it and our charts/update from last night predicted it.

First the currencies


 AUD 15 min went positive at 4:30 p.m. yesterday and went higher all night.

 AUD 1 min the 1 min shows an intraday negative divergence going in to the open


 Euro 1 min went positive at 10 pm last night, went negative at 2:30 a.m. and 3:30 a.m. and positive again at 5 a.m. and just went negative in premarket.


 USD 15 min fell all night from a negative divergence at 5 a.m.

 USD 1 min is going positive in to pre-market

 Yen 15 min went negative and fell all morning at 4:30 a.m.

Yen 1 min is going positive in to pre-market

Equity Index Futures

 ES 15 min went positive just before midnight and at 5 a.m. and lifted from there


 ES 5 min had a smaller negative at 3:30 a.m.

 ES 1 min and is going intraday negative in to pre-market

 NQ 5 min went negative around midnight and 3 a.m. and positive at 5 a, and lifted from there.

 NQ 1 min is going intraday negative in to premarket

 TF 1 min went negative at 1 a.m. and 3 a.m. and positive at 5 a.m, and lifted 

 Gold 5 min worked on a positive divergence most of yesterday, it finally turned up about 10:30 last night and lifted all night, it's going negative intraday in to pre-market.

Silver 5 min worked on a positive divergence most of yesterday and went positive in price around 10:30 pm and lifter most of the morning and is going intraday negative in to the open.

Basically everything that needed to happen on a bigger scale to support the market, the Yen and $USD fall and Euro and $AUD rise , all happened.

Equity Index futures took advantage and did the same at virtually the EXACT same times. 5a.m. figures very prominently. 

The fall in $USD helped Gold and Silver overnight.

The premarket negative divergences in risk assets including precious metals and Equity Index futures, may be nothing, but it may lead to the pullback/consolidation that I said I'd like to see yesterday for a healthier move.

Just remember the correlations, falling Yen and $USD helps the market as well as a rising Euro and AUD.

Falling $USD helps Gold and Silver and vice-versa for all mentioned above.

It worked perfectly!

Tracking Portfolio Ranks

This is just to illustrate why we buy weakness, sell or short strength and wait for the moves we expect.

Remember these are tracking portfolios (as of the close) so they have a lot more assets than I'd ever carry and the risk management is done on the fly, plus they are my last priority, with market analysis being my first and trade ideas, then member support and finally maintaining the tracking portfolios.

This is just from a few days, when the trend I expect gets under way, these should be doing incredible.

Weekly Equities Tracking portfolio


23 of 1209 portfolios puts us just about in the top .025%


Monthly Equities Tracking portfolio


113 of 3169 puts us in the top .025%

Options Weekly Tracking Portfolio


7 of 520 puts us in just about in the top 0.030%

Options Monthly Tracking Portfolio


And 26 of 1343 puts us about at 0.020%

The point being, setting up our trades in to favorable conditions and in line with our trend expectations is usually called top-ticking the market, picking tops or trying to catch a falling knife, but we are really just following signals. Before 3C, I'd never attempt to do something like that, but we either follow the signals as they are or we wait for price confirmation and in many cases the gains are gone by then, especially the way Wall St. uses Technical Analysis against traders as it and their actions are very predictable, take the last post and the 50-day moving averages, lets see how that plays out.