As mentioned and shown in a previous post, the SPY arbitrage (as well as CONTEXT for ES) do not appear to be showing any upside manipulation in the market, there very well may be downside manipulation or this may be natural trade (although I suspect Wall St. would like to see the market pullback as much as I would).
SPY ARbitrage is negative as it was earlier so it seems pretty clear whatever drove the $USD down and the $EUR up or the EUR/USD up, was responsible for moving risk assets as well.
I'm still not sure what moved the pairs, but something did and it was supportive of market risk as seen in the market moving higher intraday.
The SPY Arb model is even lower now just minutes after capturing this one.
The 3 Levers -These are the 3 assets that are actually used in Capital Context's SPY Arbitrage model, they consist of Flight to safety or safe have flows via
TLT, Volatility and as such either Fear or Greed through the VIX futures
VXX and institutional risk appetite via the risk asset of choice, High Yield Credit via
HYG.
So even before the SPY Arbitrage model can pick up the underlying flow of funds, here are the 3C charts confirming my thoughts.
TLT -20+ year Treasuries
The intraday 1 min chart is leading negative, there is a gap (yellow) that likely will be filled, to do that the market would likely have to pullback in to the area of yesterday's lows to continue its base, this would be all around good for us in taking on high probability, but short term trades. In other words, whether manipulation of TLT or not (I suspect it is), it "appears" there's a short term move away from safety and toward risk and 3C is showing the probability of a further pullback-if the market can stay in a range and accumulate while this happens, it will be very bullish for a short term move up.
TLT 3 min chart shows the accumulation, rotation in to safe haven assets (Treasuries) right before the market move, today we see more short term distribution suggesting more downside and a short term market move higher.
VXX shows the accumulation mentioned last week after we saw real demand as VXX WOULD NOT move lower despite a higher SPX as protection in options was being bid heavily. The next trading day was yesterday so smart money was prepared as we saw as of Thursday. Short term we have a negative divergence moving VXX lower and suggesting more short term lows which suggests the market make a move higher short term.
XIV is the inverse, but it confirms the same as the VXX 1 min chart above.
VXX 5 min accumulation before Monday's plunge in the market and a head fake move (yellow) before the downside reversal, this chart is in line.
Longer term 15 min VXX is leading positive, this is in sync with our slightly longer expectations of a sharp market move lower after a short term move higher.
XIV 15 min is the inverse of VXX and it confirms the VXX 15 min chart PERFECTLY.
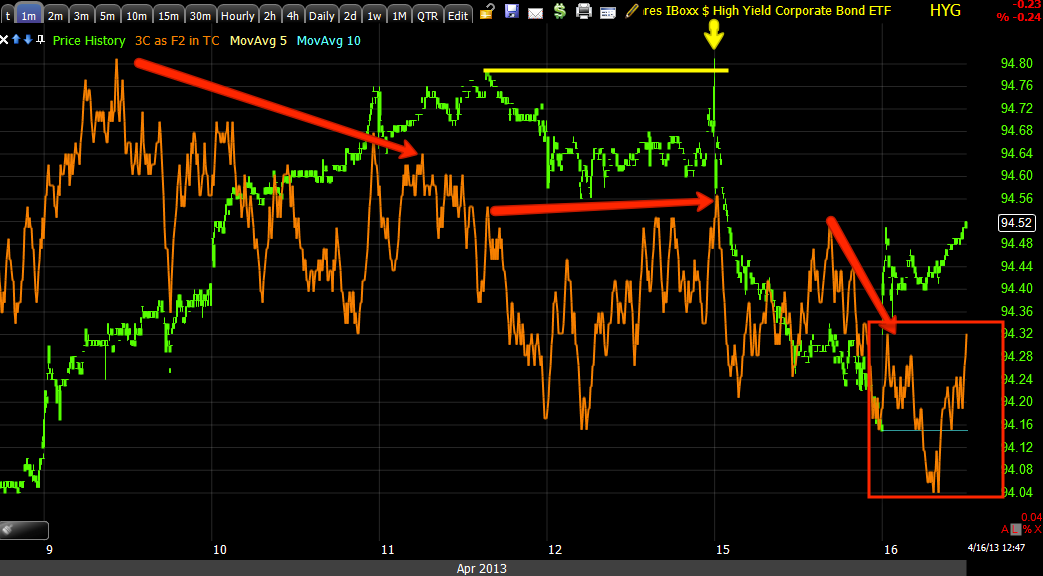
HYG1 min went negative as the market was topping last week, it also made a head fake moce (yellow)
remember we see these moves quite often just before a reversal so seeing one can often be a good timing clue. The move up in HYG intraday is not supported by 3C as SPY Arb suggests, this suggests short term HYG come down and by correlation, the market as well to base more.
HYG 2 min shows the same distribution at the top-same time as the market. It also shows a leading negative divergence now, suggesting HYG comes down short term which has a strong correlation with the market.
HYG 5 min is the longer term and just as we see accumulation in the longer term (5 min) market averages, HYG confirms, suggesting we do see a bounce or short term move higher.
This is ES 1 min at the top of the VWAP band, this is exactly where middle men filling orders like market makers on the NASDAQ and specialists on the NYSE strive to sell or sell short, the green areas are where they want to buy, so again even VWAP suggests the market pullback.
As does the 1 min ES intraday chart, leading negative. Remember all of the currency moves and divergences at 5 a.m. this morning, ES has a positive intraday divergence right there, which is also at the bottom of VWAP, the buying area.
$USDX 1 min VWAP at the sell area, the white is the buy area, the green arrow is 5 a.m. when $USDX was at the buy of lower VWAP channel, we saw this in today's first futures post.
And 1 min $USDX accumulation at 5 a.m. and a leading negative divergence since.
I would not chase prices here, you may want to consider taking profits or having a trailing stop on short term long trades that some of you took yesterday, otherwise I'd be patient and wait for the market to not only pullback, but to accumulate and that is our signal to start taking on some short term trading positions.
If that does not happen, I'd still be patient and if the market continues higher, we'd just wait for decent prices, heavy distribution (which is not present on the 5 min charts now) and then start setting up the bigger picture short entries in to market strength.


No comments:
Post a Comment