Wednesday, June 12, 2013

Change is HERE

The market Averages are leading positive very strong now on the 1=-3 min charts, this could be the start of the reversal, this is the 3C charts jumping off the page, even if only intraday so far.

I don't know if the charts will pullback and create a larger divergence, but I'm going to start opening some long call or leveraged ETF positions, they will be in the speculative range, about 1/3rd of a normal full size core position, I will only add partial positions right now, I'll wait and see if the divergence is longer lasting to add to more.

I'll call them out before adding

Market Update

Charts are moving quickly as I'd expect at this point of the market, but if we are to get a fast trap / short squeeze, then it will move even faster.

It takes some time to capture and upload these charts so they can change a bit, but this gives you a general idea of where we are and what we still need.

As far as giving bears confirmation and the chance to get in to the market as yesterday they didn't have the best opportunity, this morning's gap up which had absolutely nothing behind it other than pure manipulation, no news, no data, no correlations, it seemed to be there for one thing only, to give shorts a second chance to short at a higher level as they may have missed out yesterday. That makes the SPY look like this.
 In yellow we have the failed tests of resistance, this would be one of the most basic set ups you would find in a 25 page "Getting Started in Technical Analysis" pamphlet from 1998, that'a how obvious this pattern is and I haven't seen a true one work for well over 5 years at any important place- Do you get my drift?

The yellow arrows are the failed tests of resistance, but traders want price confirmation (a break of support or lower low before they'll pile in, the red arrows are the confirmation days.

Now the progress of the major averages, I'm not going to mislead you, it's slow going, but these things can change very fast, even before I finish posting this update.

 SPY break under the triangle 2 min chart, you can see accumulation and distribution areas

5 min chart is what defined the downside move expected in the market so until this chart is repaired, I'd say we will not see a short squeeze, this is the Maginot line.

SPY 15 min overall is in good shape, but it still can't do much until the faster timeframes align.

DIA 2 min, there's some progress, it isn't jumping off the chart yet.

DIA 3 min has some more progress, better looking, but not enough on its own.

 IWM 1 min shows where there seems to be an apparent range os accumulation/positive divergences, I highlighted it on the price scale.

 The same with the IWM 2 min chart.

And the larger IWM 15 min chart, it's in good shape, but again, the short timeframes need to align, migrate through to the 5 min charts, repair them and scream or jump off the chart.

QQQ 2 min, again I highlighted the apparent accumulation range where positive divergences are, if you look close on all of these charts you'll see a clear negative divergence on the open this morning, a strange move that had ZERO support.

 QQQ 5 min , again the range in highlighted, glad I didn't enter new longs yesterday on emotion, it never works, it's only hard facts that give you an edge.

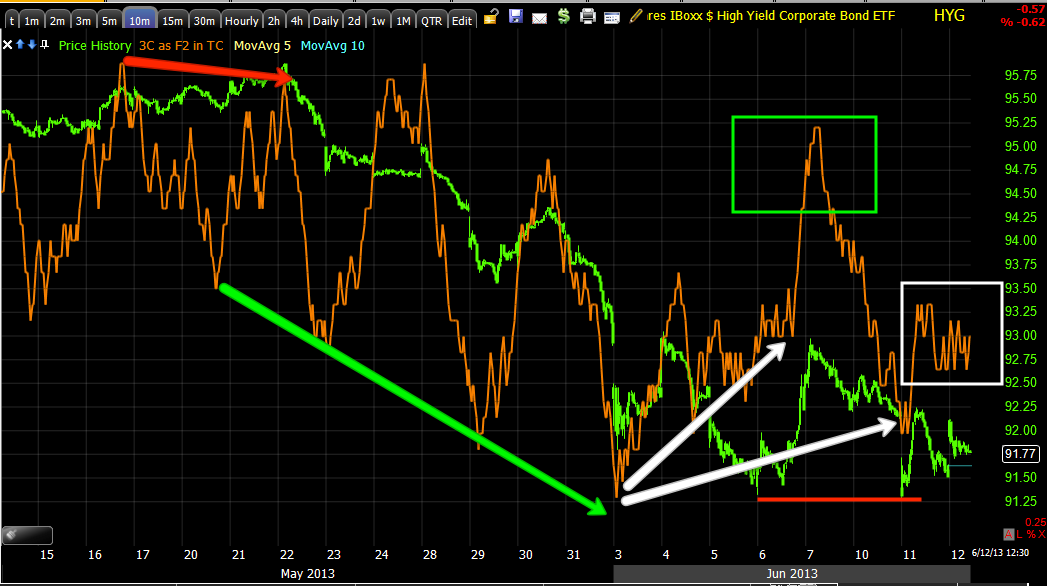
 HYG is interesting, it is an institutional risk asset, HYG "Should" be leading any market move to the downside, but as mentioned yesterday, something changed in HYG.

This is HYG in green vs the SPX, the difference in trend speaks for itself as a move down in the SPX, if it was real, would see HYG leading it, instead its leading on the upside.


 HYG & the support level I thought was key yesterday, the 2 min chart and positive areas at support.

HYG 2 min -note in green there is no distribution/negative divergence on the turns to the downside, it's as if they are keeping the shares.

 HYG 5 min with the same story.

HYG 10 min, same story.

HYG 15 min, same story. This is VERY significant.

 Note how much sharper the SPX is today vs its normal correlation with the Yen, it's almost as if someone wants to create the impression of a very bearish market, more so that other assets would account for.

 HYG (green) vs SPY (red), again note HYG holding up better than the SPY, Credit leads, just back up the chart and you'll see that on the downside moves and former upside moves so this is significant.

 TF 1 min (R2K futures) with a large relative positive divergence

 NQ 1 min (NASDAQ 100 futures) with a larfge relative positive divergence-interesting this formed overnight/

ES 1 min starting to lead positive (SPX futures)

 USD/JPY 1 min going positive-good for the market

EUR/JPY attempting to help

AUD/JPY attempting to help

 $USDX 1 min

Yen 1 min

Quick Update

I've captured the charts and will follow up with a more complete update so you know where we are, where we need to be and what are the key assets to watch.

For now, the FX regime is about to turn market positive, the Yen about to give up some gains, the USD/JPY about to gain some (market positive), it looks like the other 2 former carry positions, AUD/JPY and EUR/JPY will be joining in as speculated last night.

Another update is coming, stay patient, it's important to understand where we are.

AAPL

AAPL is doing what I expected yesterday and is looking ok for where it is right now and what it is doing, it's not in a buy position (even for a short term trade) for my standards yet, it still needs to show short term positive divergences that are unquestionable.

Two issues that may be in play are the following...

 There's the triangle that did break this morning and lifted volume as it was meant to do and there's a 50-day moving average right in the exact same area as the support of the triangle, you think that is coincidence being the favorite moving average of technical traders?

Really I don't think the 50 was broken, it certainly hasn't been broken in a way that stands out at all and I don't know if it needs to be, it may serve an AAPL move higher as apparent support that held.

The bottom line is so far AAPL is on the right track, but there are things that come with this move to confirm it that we need to see, there are some early signs, but not solid enough yet and I wouldn't expect them to be yet.

All in all, I think we're in good shape, but it's a time for patience, the time for fast action may come shortly, just not yet.

A Look At Numerous Assets

I just took a stroll through numerous assets, earlier today, I believe pre-market I said that I didn't think the gap up prices from the overnight ES ramp would hold, but we may find ourselves back up there by the end of the day. What I meant was the positive divergences that I need to see to start any speculative longs for a short squeeze move were not there yesterday, I thought it best to be patient and wait for them to develop. I also think and have thought that a fast reversal to the upside would be most effective meaning any positive divergences that develop to support such a move would have to develop pretty fast, a lot faster than normal and perhaps may even be in place by the EOD.

So far here's what I've seen, but it's fast moving and may have changed already.

USO doesn't look great as far as 3C goes, but I don't see a great set up there either, I do like SCO long which is an open position and will remain so, it is improving.

The IWM and SPY are both showing early signs of a positive divergence building, this is just a start and very early so it's not time to act on it, it's time to be patient and confirm.

I'm glad I closed the XLF put yesterday, today there's initial signs of improvement as I'd like to see

GS is also showing initial signs of positive divergences

AAPL is not yet going positive, I wouldn't expect it to this soon, but it has made the move I was hoping to see as mentioned yesterday

UNG is showing improvement, remember the volatile EIA Nat Gas report is out tomorrow.

UVXY is showing signs of deterioration, which would confirm positive signs in the averages like the SPY.

GLD is improving and I'll keep the GLD call position open, I'm not as crazy about SLV.

MCP is improving, I still like this long a lot and will keep the call positions open

HYG is showing odd price strength, I mentioned HYG's unusual strength yesterday, it did not appear that way at first look, but when you really took a closer look, there was strength there yesterday and it continues today, this is very important for any potential short squeeze.

TLT is starting to see some weakness which fits with HYG and UVXY.

These are initial signs, they need to improve and really impress before I'd enter long, you see what would have happened if I had followed emotion and done so yesterday, that's what a journal would have revealed, that yesterday's decision to ignore emotion was the right call.


And We Are Back on Track... AAPL Triggers

As I said pre-market, I didn't think the overnight ramp would hold, that was a best guess, but based on information not just a guess.

So far we have some interesting developments because this may be exactly what we need that is starting to develop.

Yesterday I felt the urge to take on some long positions, but couldn't because there was no evidence to do so, that thinking was confirmed this morning, but a couple of things I wanted to see happen may be and are happening, first we need to see positive divergences, this is just a start, but the SPY is starting to show one. The second thing was the head fake move in AAPL below $435 as the start of the signal that a reversal to the upside may be building, we are now in the right area, we just need the signals to continue to develop.

 SPY filling the gap this a.m. with a 1 min positive divergence starting in to lower prices.

 AAPL breaking below the bottom of the large triangle at $435.

The AAPL 1 min 3C chart with a negative divergence sending price below support, an event I talked about yesterday as a timing marker.

We keep watching, stay patient.

Opening Follow Up

Well, it was a strange opening, a strange overnight ramp and things continue in the realm of strange with more spped now.

There's nothing in the intraday charts from yesterday that suggests an early move up would hold, there's no confirmation, the NYSE TICK is ugly....I still don't think it holds, it's out of nowhere, but we still need to wait and see.


Here are the firsst two ES charts of the last post and the current.

 The first chart with a negative divergence.

 Second pre-market chart with a leading negative divergence

Most recent chart with a deeper leading negative divergence

Compare ES Charts

This is the first capture of 10 mins ago and the second of 30 seconds ago, note 3C's position.

 First ES chart...

Second, or most recent. 3C is leading negative very quickly.

Ir seems something is going on, the opening should be interesting.

ES Getting Worse

The divergence in ES is getting worse, with no real foundation under this, I don't expect it to hold, however we are at that point in the market where stranger things have happened.

I'll keep you informed.

Pre-Market

Good morning.

Well, I've looked pretty much high and low, nothing of interest went on last night, the Japanese markets were "relatively quiet", the USD/JPY gained a bit, but nothing special, Index futures were simply ramped overnight, why, for how long, is this the quick reversal I was talking about yesterday? I have no idea, there just isn't anything sticking out to support it, it just happened, whether it holds in a.m. trade or not is a question we'll have to wait and see as far as the answer.

My gut feeling is this does not hold, just because of what I see on the 1 and 5 min charts and general market behavior, if that be the case, we may end up here on a close any way, it would be one VERY volatile day.

All of the Index futures look roughly the same, here's ES...

 ES 1 min has a slight negative going in to the open.

The USD/JPY wasn't responsible, it was pretty flat all night.

I'll do an early check of opening indications