Wednesday, September 18, 2013

No Taper-Does the same thing-Watch GLD and GDX long positions

4 min.s and counting...

I will likely be radio silent for the next hour as I watch the market reactions, especially at the 2:#0 Bernie Press conference, so I'll be watching that, this is how I determined the F_E_D was looking for an out on Sept. 13th when Qe 3 was announced, it was 2:24 p.m. when the question was asked, if I had not seen it live, I would have never been able to see it.

I can't Ignore This

I wish the set up was more obvious, it may simply be the long term charts are the set up, it may be the set up comes after the F_O_M_C, but I can't ignore these Index futures, even if I can't put them in to actionable context.

 ES/SPX Futures 15 min chart leading negative divergence, quite strong.

This at least tells me if there is a knee jerk higher, Wall St. didn't buy in to it, but rather plans to sell in to it, otherwise we'd have accumulation or a flat or in line reading.


TF/Russell 2000 Futures, the same thing.

This is a strong negative divergence for this timeframe and this quickly.

Another Scenario

This one would force us to react VERY quickly, it doesn't have as much Wall St. intervention, but because of some of the intervention I see in currencies like AUD, USD and EUR, I think this is less likely.

The SPY is the example. I posted earlier the SPy (the only average) was (still is) showing a 1 min positive divergence.

 TICK data has moved gradually, but methodically from negative to positive.

So I'm thinking in much shorter terms, but an initial knee jerk higher that is sold in to today, the only reason I'd go with this if I was the magic hand was if I thought I couldn't make it up to many of these breakout points, I personally think they can and that's why I asked you to become familiar with the concept in the FRP video. I don't think that move to breakout can be made later, it's now or never as the market will front run the end of QE like it has the last 2 times.

 SPY 1 min positive, but only 1 min positive.

Imagine an initial knee jerk, perhaps it is strong and fast enough to create these head fake breakout moves today and turn them in the next 24 hours, making it a much shorter process, the downside for Wall St. is there's not as much volume and they can't put on as big of a position.

The 15 min SPY chart is clearly negative, it shows what they have been doing with higher prices, they aren't about to go bullish no matter what prices do, they'll sell in to them, but this would be a much more abbreviated form of the previous post.

Keep in mind though, there are few really strong indications other than the accumulation (late August forward to the move up last week)  range and move thus far which I envisioned, originally to be stronger, so I could be way off and Wall St. may just have no clue what the F_E_D does, but it would have to be a surprise and if the F_E_D does nothing, up we go because Wall St. is prepared already to accept a $20 billion a month taper in Treasuries and down to $30 bn a month in MBS, I don't think the F_O_M_C will be more aggressive than that.

Final Pre-F_O_M_C Update

This is a hard market to read, whether we get a taper or not may not be what the market really cares about, the size and pace of the taper seems to be more likely to be the subject and ANY guidance on rate hikes which I think the F_E_D will try to defer.

If the F_E_D announces a taper (F_O_M_C really) the market seems prepared for it with more taper in treasury purchases than MBS at first so there's going to be a whisper number on the street in which a taper could be announced and not as bad as the whisper number where the market takes this as a positive despite the taper being announced- a lot like earnings whisper numbers.

I suspect from what I see today (and there's no smoking gun, I really think the market doesn't know what to expect) I THINK AN UPSIDE INITIAL KNEE JERK REACTION IS LIKELY.

HOWEVER, REMEMBER THAT AS I ALWAYS WARN, KNEE-JERK REACTIONS ARE ALMOST ALWAYS WRONG WHEN IT COMES TO THE F_E_D, I ALWAYS WARN OF THIS.

The easiest way to sum up my current feelings (which I'll not be closing any positions, nor opening new ones unless I see something mind-blowing really soon) is knee jerk effect takes us to the FRP concept and I'll show you some reasons beyond the FRP video / concept (the concept being the most important) in other assets.

However if we split the market response in to knee jerk and correction of the knee jerk, then these two charts may best exemplify the market's reaction.

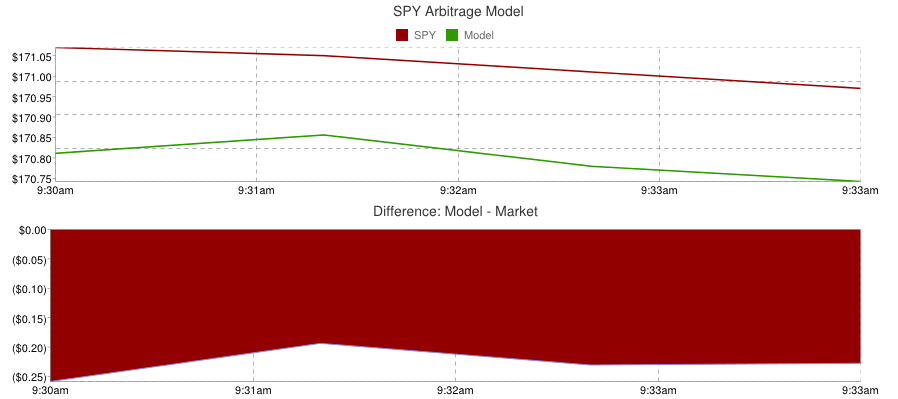
 Intraday the SPY Arbitrage is on again, perhaps there is a known element or perhaps there's just a planned reaction despite what the F_E_D says and again that's the FRP concept.


CONTEXT -77 points, amazingly large disparity, this being representative of the correction after the knee jerk, after stocks like FRP make a head fake breakout high that is easily shorted in to.

What else suggests Wall St. may be preparing for an initial positive knee-jerk? Currencies.

The $AUD (FXA) vs the SPX, is seeing strength, so is the Euro and the $USD looks like a positive intraday divergence is taking over, the Yen doesn't look bad, but it looks stalled so if it stays where it is and the AUD, EUR and USD all move up, the carry pairs will all pressure the market higher, although they are truly dead, they can move the market for a day and in this case if they are being set up, then more.

As far as some examples along the FRP concept of "Make the breakout high, get retail to chase and short in to the breakout high / head fake", which is the concept I tried to pass on in the FRP video, I told you there are a lot of stocks ALMOST there, but not quite, this is the best shorting position we've ever seen and have always had good luck so long as the signals are there. Here are some examples.

 XLF intraday isn't looking great here, I'd almost short it or put it out there, but more importantly is this...

 XLF 30 min negative, this is where the probabilities are, but XLF is not a FRP style stock that is close to a breakout at the last highs so it's not showing the same signals as we see below.

 NFLX 3 min positive is showing a different signal, this looks like the knee-jerk effect up.

Of course the longer term 30 min is distribution, but like FRP, NFLX only has a little way to go to a break out high that retail will chase that smart money can short in to heavily.

FAZ 15 min (3x short Financials) would be best to make a double bottom "W" and a head fake move below that and buy there (short financials), again, it would need an initial positive market reaction to get there, the FRP effect in reverse.

FAZ hourly? Do I want to be long or short FAZ in the Core positions? Long of course, but the entry is even better a bit below the last low.

PCLN is so close to that breakout, but it won't get there without the knee jerk up reaction, after it does, it becomes a high probability head fake and this is why.

Daily PCLN massive distribution, it's the head fake move that is the reason, it's what allows Wall St. the volume they need.

Now in addition we have a debt ceiling and budget fight coming up too, the market doesn't like that so beyond the tapering and initial knee jerk, things look good for the market to fall apart, we are really talking about tactical vs strategic (short term vs long term).

As for the averages and other stocks, VIX futures saw bidding, but that's normal, remember the 2-4 hour leading positives, that's where I want to be on core positions, any move down on a knee jerk is 98% going to be a useful head fake.

 DIA 60 min, where do I want to be on core positions? Short.

IWM 2 min, doesn't look great as of the capture, but not horrible.

However the IWM hourly is nasty, this is where I want to be core short, but if a knee jerk can take us higher, it's a better entry, if not then established core short positions will do well and they can be added to on counter trend moves.

 QQQ 2 min looks like distribution in to strength, what would be likely on a knee jerk higher? The same.

SPY 1 min as of the time of the captures was the only one positive intraday, however...

Look at the distribution in to higher prices, this is the point of a head fake move, except it generates volume which Wall St. needs in the size they trade.

I don't know because the F_O_M_C may surprise, but my guess is Wall St. knows the taper is coming and it's not good no matter what, but they need bag holders so even an engineered  rally like SPY Arb and carry currencies look today, will benefit their short position, they may hate what the F_O_M_C says, but still NEED to move PCLN and other stocks like it above the breakout area to get retail to hold the bag.

Some stocks that just look horrible, that are core shorts.
 GS 60 min on the bounce and look at the 3C divergence, but yet again, it's only a hair away from a breakout move that retail will chase, that gives Wall St. the ability to sell to that demand and selling short is selling.

 GOOG which I closed as a short because I saw the counter trend move coming, but will add back, I'm not sure, but maybe a new regional high will give me the opportunity.

JPM 4 hour, a regional high above the congestion of the right shoulder is enough to get retail to chase and make JPM a great add to.

*I WILL SAY THIS IS MORE GUT INSTINCT THAN HARD, OBJECTIVE DATA ALTHOUGH THERE IS SOME IN THERE...

THIS IS, "THINKING LIKE A CROOK", IF I COULD CONTROL THE SHORT TERM OF THE MARKET WHAT WOULD I DO AND THE FRP EXAMPLE IS WHAT I'D DO.

When I look at how close a lot of these major stocks are to a head fake move that I'd want to short, I don't think I'd let the market determine the reaction to the F_O_M_C no matter what it was, I'd spin it, I'd support the arbitrage and cacarry trades and make the short term move I want, HAPPEN. 

When you are talking about trillions of dollars, possibly years of secular bear markets, what does a week or tow change? NOTHING, but it gives you huge advantage.

***I'LL KEEP LOOKING RIGHT UP TO THE F_O_M_C, IF I SEE SOMETHING DIFFERENT, I'LL GET IT OUT RIGHT AWAY, BUT THINKING LIKE A CROOK, THIS IS WHAT I'D DO.


Leaked EIA Petroleum Data?

The last few days I've been looking for an upside reversal in crude, I talked about it last night, specifically I think it moves up, but in to a choppy range and longer term I don't love it and think it will come down, but the first part was the recent positive divergences making me think oil / USO moves up.

Take a look at USO today, not sure if anyone is in the position, but it's up over 1% with a big move on the 10:30 EIA Petroleum report.

Released On 9/18/2013 10:30:00 AM For wk9/13, 2013
PriorActual
Crude oil inventories (weekly change)-0.2 M barrels-4.4 M barrels
Gasoline (weekly change)1.7 M barrels-1.6 M barrels
Distillates (weekly change)2.6 M barrels-1.1 M barrels


Domestic production showed little weekly change while imports were down sharply which, together with strong demand from refineries, made for a large 4.4 million barrel draw in oil inventories to 355.6 million barrels which is the lowest reading since March last year.

Refineries, operating at a very strong 92.5 percent of capacity, increased production during the week but, due to increased shipments to wholesalers, inventories fell for both gasoline, down 1.6 million barrels, and distillates which were down 1.1 million barrels.


The divergences we have been seeing in USO may VERY well have been a leak, the EIA Petroleum report use to be one of the most reliably leaked reports about a year ago and considering the extreme nature of the data, I wouldn't be surprised if some professional network got the data out to Wall St.
 The response this morning to the EIA report, a nice move up o  significant volume.

 I believe yesterday's break below support was a head fake move and the EIA data was leaked, here's why...

This 3 min leading positive divergence (which is the longest/strongest of intraday timeframes, but fast enough to respond to accumulation on a 1-day head fake break) shows a leading positive divergence, remember head fakes come at least 80% of the time just before a reversal for several reasons you can read about in my articles linked on the member's' site, "Understanding the head fake move".

Most of the leading positive divergence or at least half of it was YESTERDAY as prices were below support, the proof of a head fake move we look for.

I mentioned the divergence and likely move, but was not interested much myself because I believe it just moves back in to a choppy range, however, "IF" oil can move above the yellow trendline and we can continue to confirm deeper leading negative divegrences, a short there would be very interesting to me.


Gold / GLD Update

Gold is a tough one because it has been long associated with QE as an asset that benefits from QE, but if we are honest, it was an asset that benefitted immensely from March 2009 through September 2011 when we called an Intermediate top at minimum and perhaps a primary top (meaning gold goes in to a bear market and not as media defines as a 20% correction which has NOTHING to do with trend classification from a Dow Theory standpoint which is the official viewpoint of market participants, the -20% is a dumbed down version as Dow Theory can't be explained on CNBC in a 30 second spot).

When I taught my students Dow Theory trend classification of the 3 trends: Primary, Intermediate and Short (most technical traders have added a fourth Sub-Intermediate), this was the most difficult concept of all to teach and being it was not necessary for them to use it to the letter of the law unless they were financial commentators (beyond that of CNBC), I gave them an easier way to determine trends for the most part using moving averages.

The way I put it was this, a Primary trend is represented by the direction and if price was above or below the average and in the same direction (for instance the average moving down and price under the average), for a Primary trend this was a 200 day moving average, by that count GLD would be in a primary down trend, a 50-day represented the Intermediate trend which GLD would be in an Intermediate neutral moving to a downtrend after just having performed a counter trend rally, and sub intermediate would be a 22 day,  GLD would be Neutral in that classification and short term a 10-day and that would have just turned from up to down.

The point is, even during Operation Twist, Twist light and QE 3, Gold has NOT benefitted from QE, so the current conventional wisdom of the week is that Gold rallies on a "Taper OFF" view and Gold falls on a "Taper ON" view, when the last 2 years have proven this to be exactly wrong.

It was just last week that gold was acting as a flight to safety, now it's suppose to be acting as a QE determination, it's ridiculous.

That brings me to the next point, no one knows what gold's correlation is from 1 week to the next, but the last 2 years have shown that it's difficult to say, but it has not benefitted from QE3, in fact since the announcement of QE 3, it has moved down dramatically!
This is a 200 day moving average so you can see where the Primary trends would have turned, also where we called a top in gold which I still celebrate as I warned a fund manager who was a gold bug, he mocked me and then got creamed, sorry, but no need to be nasty when someone is trying to help you.

The first of the lower highs and lower lows (red lines) was EXACTLY at the announcement of QE3, so you see how gold performed during QE3, it's not exactly what everyone is claiming this week. You can see the concept I simplified for my students as well with trend classification.

So don't be quick to judge what gold's movements mean or what conventional and weekly changing wisdom says they mean.

There's a decent chance gold is making a head fake move, today would be the day to do it, but volume hasn't picked up so it may have to head for the whole number at $125 to hit substantial stops.

Here's what we have so far.
 This is GLD's 10 min chart, it's the more important chart because while I believe gold has more downside to go, I also think it has another counter trend rally in it, this is one asset to be very careful with as far as initial knee jerk reactions considering what you saw above about its behavior during QE3, it contradicts EVERYTHING being said of gold this week and it is proof, not words.

Today may be a stop run and on a QE day, if gold is actually a flight to safety trade which it's inverse market correlation would suggest, then after a knee jerk, gold may in fact press much higher if the taper is announced today which I think will be a trial balloon of 15% or so and mostly in Treasuries and not so much in MBS.


 Note the trend is opposite the SPX, as the accumulation range for the SPX was late August.

This is a descending triangle, this is a technical price pattern that is a BEARISH consolidation/continuation pattern, being the preceding trend was down, it fits perfectly here and the break below the triangle is EXACTLY what technical traders are taught to look for, making this an ideal head fake move as Wall St. knows how technical traders will respond to this classic price pattern.

So far it looks like the break hasn't hurt the 3C trend at all (2 min).

Gold Futures look even better, so don't be too quick to judge this asset or accept this week's conventional wisdom when you saw what the last 2 years have done, that's the real wisdom.


Retail BTD?

If anyone has a Twitter trend in sentiment, please send it in, as long as it is dominant. Some initial 1 min signals on the slight declines so far look like there's "Buying the Dip" action which is the motto of retail "when" they are bullish, I haven't seen them embrace "Sell the Rip" yet so while they still will turn bearish with the wind blowing, they will not sell the rip, they just switch back from BEARISH as can be to bullish as can be, they have no opinion beyond what price is doing at the moment, as Sam said yesterday, that must be a stressful way to trade.

Here's an example of why I suspect, retail is buying the dip, which could provide some useful tactical entries if they do and price rises and locals step in to sell in to that rise, even if it remains range bound at yesterday's highs.

The IWM
This is only 1 min, the TICK data is worse and volume appalling so I suspect this is retail.

The IWM is just an example, this same trait is seen in all of the major averages.

The idea is to look for retail to buy the dip (if we can get a sentiment update as long as it is dominant from ST or Twitter, that would be helpful), price to rise, it doesn't matter how much and then to see if there is clear and heavy distribution, that would be a tell and that would be something worth considering for a trade. If the action were really extreme in 3C, then we might have a leak.

Opening Indications

Although the market seems to still be playing its cards close to the chest (from the overnight session), there are some initial (as much as I hate a.m. trade data because of pre-market and overnight manipulation) signs.

First it looks like the MOST SHORTED Russell 3000 (Custom Index) did see the predicted opening squeeze and looks to be continuing the start of the end of the squeeze seen late yesterday with the first lower low of the afternoon and first clearly negative 3C divergence, the squeeze this morning on the open was short lived.


The most shorted R3K names (red) vs the Russell 3000 (green) saw an initial opening burst higher that failed quickly, the short squeeze was what drove afternoon trade higher in Russell indices, SPY arbitrage drove it higher to the squeeze in the a.m. yesterday, both are waning.

 The initial 1 min IWM 3C negative divergence yesterday so far continues this morning (yellow) as the straight trendline typical of a short squeeze was broken at the closing 30 mins. yesterday with the first lower low of the afternoon, this morning we are making another. If I had to (which I never do) take a trade right now, it would be IWM short, perhaps the 3x leveraged SRTY.  This is more theoretical than actual at this point as I'd never take a position this early with just the start of confirming data, but if I had to this is where it would be.


The 2 min chart of the IWM has quickly fallen in line with the 1 min in going negative, so this may turn around quickly. I'd be patient, wait for stronger signals and typically they'll come in some sort of range so there's still a chance to get a good entry with good confirming signals.

You never have to take a trade, sometimes sitting on the sidelines is the best course until a trade shouts and jumps off the chart.

As I said, the SPY Arbitrage that I expected late Monday to push the market higher, died yesterday afternoon when the IWM short squeeze took over, it is still dead so there's no engine for the market as none of the carry trades are leading the way either.

It appears the tactics of short term manipulation are either no longer needed or exhausted.

CONTEXT for ES futures is still at -85 negative ES points, a huge dislocation that is twice the size of anything I've seen in a year.


TICK data which was mellow yesterday is even more so on the open today in a range of -/+ 250, nearly flat, meaning almost perfect symmetry, nothing moving up or down, at least as of this capture, this sums up the overnight session nearly perfectly.

A closer look at the time of capture, this is truly pathetic, it couldn't be any closer to zero.

A quick updated look reveals some more downside to -500, but this is still for all intents and purposes, FLAT.

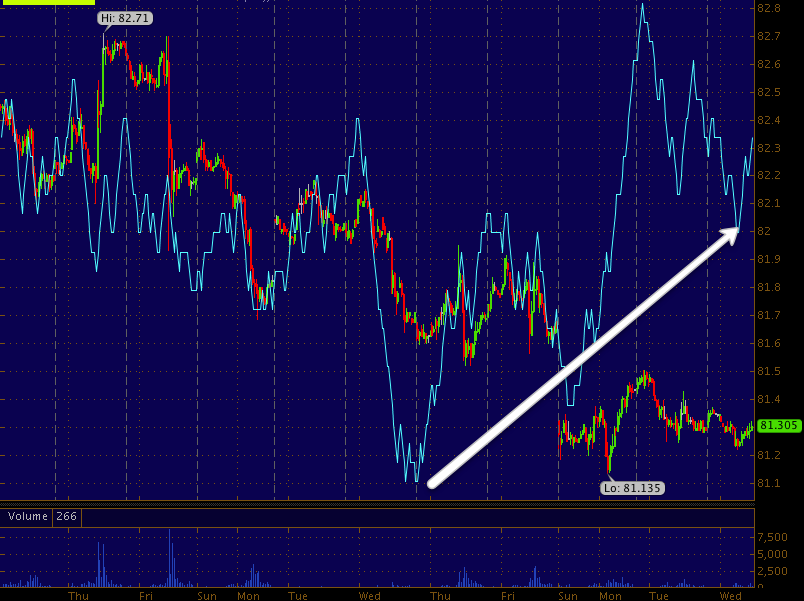
My Custom TICK Indicator v. the SPY, you can see the negative activity Monday, the more positive yesterday and today's nearly flat in yellow, very odd, from very negative, to pretty positive to totally flat, I'd expect flat yesterday at the EOD, although yesterday's TICK data was not impressive in any way.
So far it "seems" like there is little movement or the market is trying to hide movement for those following internals, we will see what the 3C charts say shortly about that.

F_O_M_C Wednesday

For the 4th time, the most important F_O_M_C meeting ever, is the 4th time the charm or the taper?

Strangely, very unlike Monday overnight when the 3C overnight market was crystal clear, the overnight market for most assets was not only choppy, but flat in 3C, not meaning 3C isn't working, but no one seemed to be doing anything.

There was a bid in some safe haven currencies and the Yen, although the Nikkei 225 has been flat and choppy more or less this week.

I was shocked to see gold and silver (more gold) looked the same way and the $USD, almost as if the market has no sense of what to expect or like Monday, the pop or drop will occur suddenly as regular trade opens.


The $AUD was rangey / choppy, but losing 3C support, the Euro looked similar, but closer to inline, it's the longer term, more important $?USD chart that looks definitely taper on, the 30 min positive.
 30 min $USD looks like it will move higher, this is not a good signal for QE lovers, you may recall VIX futures look the same, again not good.

However VIX futures don't trade overnight so we don't know what they'll look like yet, early trade will be the key.

Crude as I said Monday night looks as if it will bounce as this 5 min positive chart is starting to show, but I think it will be a bounce to nowhere or in to the chop. At least it was a rare overnight signal.

ES gave some hint of negative overnight activity, but it was worse during regular hours yesterday.

I'd say it looks like a holding pattern overnight not wanting to give away what may be a surprise attack like Monday's open.

We'll be watching as we have found major moves 2 hours before the F_O_M_C that were easily tradable, even on QE3 day (Sept. 13th 2012).

Housing starts and permits missed, but since last starts were revised lower, today's 5th consecutive miss could be spun as an increase with the former revised lower than today's 5th miss in a row.

Starts was no better, the rental business seems to be dying as predicted, the annualized rate of sales (mostly cash and private equity firms) dropped from a high of 356k annualized in March to 252k annualized, remember I said, "Watch for these firms to start dumping portfolios of 75k rental units/homes at a time, just wait.

As ALWAYS, BEWARE THE INITIAL F_O_M_C KNEE JERK REACTION, 90% OF THE TIME IT IS WRONG, LASTING BETWEEN A FEW HOURS TO A FEW DAYS.

I may be slow on email responses if I get a scent and start looking everywhere to confirm as the information pre-F_O_M_C is most useful and we often or at least often enough, find it despite price action to make for some good entries, this would be the best.

Good trading to you!