Earlier in the day (mafternoon), I mentioned that VIX futures did not look bid, the bid for protection against a downside move. You probably recall all last week how I was saying the accumulation was weak at least until Friday. I also said the very fine line between the positive short term and the negative long term is very fine, the short term is very weak and the long term is very strong. I suspected there's be some games to get the market higher like a breakout above the obvious IWM Bullish Ascending Triangle, they need retail to do some of the work and a move above the triangle can do that.
Well they took that weakness in VIX futures which may not have been weakness at all, but manipulation and as an easy asset to manipulate intraday, used it to do a number on the close, but this was planned out well ahead of time.
15 min VIX Futures and the 3C lagging weakness I mentioned, this made it easier to send VIX futures lower near the close.
VXX which is one of the triggers for the algos/computers, sank quickly on a leading negative that was set up hours before as you can see in my market updates with weakness in VIX futures first.
Since the VIX trades opposite the market, the market ramped in to the close.
Here's the intraday IWM, first clearly negative and made a downside move, then a market update said the 21 min charts are going positive,
this is the market knowing ahead of time what is going to occur in to the close and positioning for it.
The SPY might be a better intraday example.
A clear intraday negative steers the SPY lower off intraday highs and then a VERY clear 1 min positive builds out until the ramp takes place.
That quite literally is the evidence of traders, market makers, specialist, computers, etc taking a long position for a ramp in to the close, considering HFTs trade in micro seconds, a couple thousand trades executed per second for a few cents here and there really adds up.
The point is, we saw the set up earlier in VIX weakness, they knew what they were doing because they were doing it.
The SPY 15 min still looks like it can and will make the upside move I've been talking about,
as I said earlier today, the short term long positions are difficult, but when we start entering or adding to the long term core shorts, these positions will be MUCH easier, the trades will last longer, they won't need baby sitting every minute and they won't need excessive leverage like options.
The only thing we need is the same thing we've needed this entire time, bulls to take the bait and a breakout of what I've already called several times,
"A manufactured price pattern" in the IWM.
This 10 min 3C chart of the IWM also suggests more upside, although futures tonight don't look very supportive of it.
Do you think it's coincidence or a natural occurrence that a "bullish" technical price pattern which is larger than normal, shows up right now with price just at a break out level in which technical retail traders will not only watch, but likely chase?
I've said since last week, "This price pattern is no coincidence". The market itself I don't think has the juice to make the move and judging by 3C, I don't think smart money wants to invest what it normally does to make a cycle like this work considering how close we are to a deep ledge, take the IWM 15 min chart...
That's the difference between the 10 min and 15 min, that fine line between a breakout and a total break down and
this is why smart money isn't willing to invest in the cycle as normal, THEY ARE COUNTING ON RETAIL TO DO IT!!! Why else would that ascending triangle be there? WHY ELSE WOULD FUTURES BE GREEN HOURS AFTER THE U.S. GOVERNMENT SHUTS DOWN as they are ramped or held together in the low volume of the overnight session?
This isn't going to be a cake walk with such slight difference between an upside move and an avalanche, but we stick with probabilities and objective data and we don't gamble.
I was hoping by this time, Index futures would show some reasonable 3C support to make this IWM breakout stick and see follow through, but I was disappointed to not only NOT see that positive support, but in fact it looks like they are selling in to even this small move. This doesn't mean that the market falls and can't move up as distribution, like accumulation or reversals, is a process, but it's one well under way.
Sentiment is split between out two Leading Indicators, but the one that is positive was positive all day, long before the EOD ramp. HYG and JUNK Credit showed better relative performance than I expected, HY credit isn't gaining ground anymore, but it's holding that positive stance it has had for the last 7-9 trading days vs the SPX.
The hammer I talked about in the daily SPX chart was not for conversation or to take up space on these pages, it meant something and tonight you can see clearly what it meant. Remember, the increased volume on the Hammer (upside reversal candle) gave it a much higher probability of success, I'd say if a normal hammer had a 65% chance of a reversal, when volume increases that goes up to about 85%, maybe a bit more so it was a significant signal.
SPX daily reversal, today's candle confirmed yesterday's hammer reversal.
Now, to kiss the channel goodbye or to try to get into it? I think getting into it is a tall order, but that would normally be my response, all we really need is for retail to turn bullish, if we get close enough to kiss the channel, we are close enough to enter it and cause all kinds of havoc for retail shorts.
The Dominant Price/Volume Relationship among each of the major averages' components was
Price Up / Volume Down, as you might imagine. This is actually the most bearish (weakest) of the 4 possible outcomes and it was DOMINANT through all 4 major averages.
I even looked at IYT/Dow-20 / Transports for a short term long position because I had a very strong feeling that to make a rally believable, transports would have to join the Industrials, this is another example of a total farce of Technical Analysis Dogma rigidly adhered to with no understanding of why. Wall St. sent Transports up because retail expects them from Dow Theory which was put forth over 80 years ago. Back then the Industrials and Transports which were almost exclusively railroads, had to rally together, it only made sense as an industrial nation; if we produce more industrial goods, the transports should do well as they have tio ship them, but the U.S. hasn't been an Industrial Economy for decades now, we are a services economy and transports (except maybe Fed-Ex that deals with services) are totally irrelevant and we all know the economy is not doing well so Transports are not doing well,
it's just another thing Technical Traders believe so Wall St. put it there for them.
As for Breadth, stocks above their 200-day m.a. were at 61% at the August highs, they're at 51% now and down from 82% January 23rd.
Even though the SPX made a higher high, stocks above their 40-day m.a. did not. The McClellan Summation Index is making its second lower low instead of moving up with price, the points are May highs, July highs saw the first lower low and current highs are seeing a lower low. From May we were at +3500, now we are at -500, a clear sell signal using the MSI.
We know the market isn't strong, this isn't news, the question is, "Is it strong enough to pull off this heist?"Futures tonight aren't inspiring me, but I think Wall St. will do whatever they have to to reach the goal and we're hot on their tails.
Of note in futures tonight, gold futures are showing improvement finally as are silver, I wouldn't run out and buy them, but they can go back on the watchlist as they come out of the twighlight zone.
I closed the TLT put today for a +16% gain and said I'd look for a new entry on a bounce to re-enter, it looks to me that 10 and 30 year futures are getting enough support for that bounce so today's sale seems to have been perfectly timed and sets us up with another trade opportunity.
In my opinion, crude/USO are in trouble, but I think we can see 1 more bounce above the recent range that sets up a long term / trending short, so that bounce looks like its tradable, that one will be on the watchlist as a counter trend bounce as the downside looks like it will curtail shortly as 3C improves short term so that would be a quick long with leverage and then a core short set up above the downward slanting range it broke under.
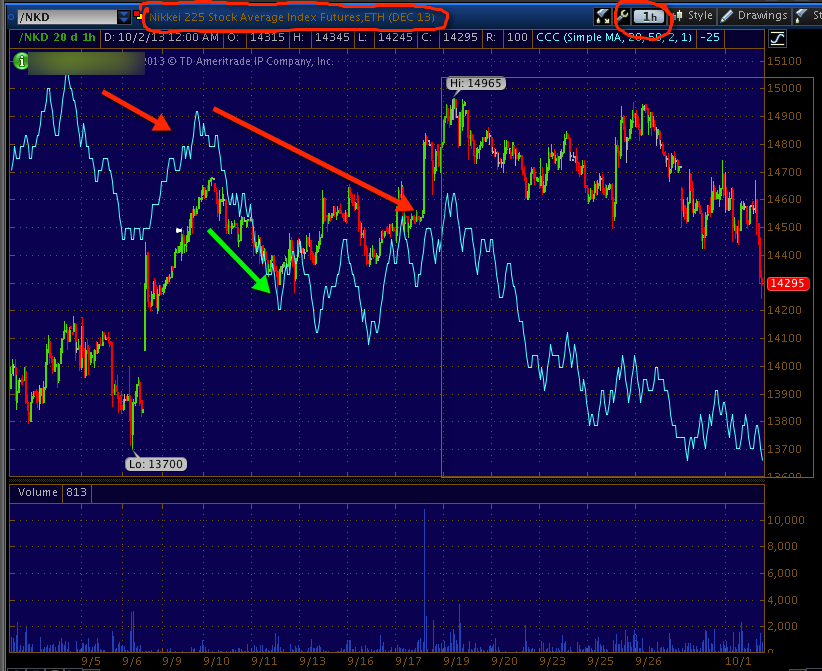
This may be a problem for the market, it's not helpful, but the 60 min Nikkei 225 looks really bad, maybe it can get a countertrend bounce in somewhere, but for all intents and purposes, this is looking like you can stick a fork in it.
Nikkei 225 Futures 60 min LEADING NEGATIVE and this is no joke, this is VERY serious.
Note the flat-ish trading range as 3C saw deeper and deeper distribution, this is so typical, it's an effect of trying to fill institutional sell orders near VWAP or a range designated by the Institution, it means a lot to the middle man (market maker) and the firm they work for to get and keep business like this for a number of reasons, so these flat ranges with distribution or even accumulation if it is a bottom type range, are very frequent.
This is why I always say, "You know there's trouble when the kids are a little too quiet in the room next door". These seemingly boring, flat ranges are actually seeing some of the most intense activity which is why I say, "Above all, PRICE IS DECEIVING".
FINALLY...
Short term it looks like the $USD could see a bump to the upside, nothing spectacular though. I think the $AUD saw a short term bottom last week and is in a small uptrend, it looks like it is correcting right now, but should continue higher, this may be fuel for a carry pair like AUD/JPY to help drive the market higher.
I don't have a strong read on the Euro except for the larger trend which is negative, but in the short term, it's hard to read.
Finally the Yen's move up has been pretty well supported, but since it made its high Friday morning, something has started to shift. It's not an obvious leading negative, but it's not the same confirmation it had since mid-September, so if the Yen drops and the USD, AUD or EUR can pick up the ball, then the market gets a lot of help it seems to desperately need.
Still, all in all, Wall St. wants and needs something and I think they will push to get it, they are just doing the bare minimum right now as we saw with last week's signals.
The Debt Ceiling is the event the market is really worried about, the Treasury has kept the U.S. alive and cutting those interest checks, but we officially ran out of money during May, the Treasury has been doing "Creative Accounting", the kind you or I would go to jail for, but their creativity has kept the money flowing for a bit longer, but come the 2nd-3rd week of October, all
extraordinary measures will run dry. For the Republicans, they've looked like spineless cowards the last several years and it's hurt them in the polls,
I think they need this fight with Obama and as for the Dems and Obama, Federal Health Care has been the Holy Grail for some time, remember "Hillary-Care" under Clinton?
It's like whichever Dem got Universal, Federal healthcare done, was going to be akin to getting the "New Deal" done, so Obama who went after this goal rather than focus on the economy because he knew that was his best chance while the Dems had the seats to pass it, to get it done. They are not going to back down, even though by their own admission, the system is so plagued with glitches and snafus and there are so many labor unions who will need to be exempted to buy their silence, it really could take the year the Republicans are after to stall it just to fix the logistical side of things.
The point being, the Continuing Resolution debacle we are experiencing now is being viewed as "What's to come" with the debt ceiling, if it's not resolved by the time the treasury runs out around Oct. 22nd, the government will have to automatically and immediately slash the budget by 32%, you think 800,000 Federal Employees with no paycheck is a hit to GDP, just wait and see what happens when the US OFFICIALLY DEFAULTS ON ITS DEBT!!! That 2011, 20% drop on the last debt ceiling debate that was settled in time, would look like a pullback compared to what would happen as the USD's reserve currency status is worth little more than toilet paper, but a lot more than treasuries.
In my view, this is why there's such a thin line between the IWM 10 min, "I think I can bounce" and the IWM 15 min, "You are going down, it's just a matter of time and not much of it!".




 | Theme by Thur