Friday, November 15, 2013

PCLN Core Short Position Update

You probably recall about a week ago I said I like PCLN as a long term core short, I have a partial position open, but wouldn't fill it out until PCLN crossed $1100 which it did a day or two later, the set up was that obvious.

The bottom line for today thus far is PCLN has done what I hoped to see for a second day, I really like the way this is developing, the trade is coming to us as we expect, however if I have to decide right now whether to fill out the remaining position, I think I give it a day or so more unless the afternoon trade makes a significant change. However if I had no exposure to PCLN (I prefer to phase in to positions like this which is not the same as "Dollar cost averaging" because this is part of the risk management plan from the start, not a reaction to a losing position) I'd have no issue with adding half of my intended full size position on a day like today or perhaps on a bearish confirmation candle which could develop today because the gap up would allow for a bearish engulfing candle today


This is the last PCLN update from yesterday PCLN Update...

"Thus far today, the daily candle in PCLN is just as imagined and so far perfect, another star/Doji in the area with a bearish confirmation candle would give us an appropriately sized reversal process rather than a "V" shaped event that is very rare....

"Yesterday's large, bullish candlestick was VERY unlikely to just reverse down today no matter what 3C says, it's too tight and no reversal process, there's a reason for the process and why "V" reversals are so uncommon....

Today's star is a near perfect second day candle, one more would make the process a little wider and a bearish confirmation like a bearish engulfing candle would round PCLN's reversal process.... So, I'm not making any moves in PCLN yet, but what we hoped to see yesterday did develop thus far today. Another day or two could be the sweet spot to fill out the rest of the position."

Today's charts and some longer charts that haven't been in recent updates.

 First the long term character of the trend has changed in 2013, the same happened to MSFT when it was a momo stock and AAPL saw the same before it topped.

The "seemingly" bullish Rate of Change to the upside is one of the earliest signs of a top about to take hold, look at tops and the trends just preceding them and there's almost always a change of character that looks bullish with increased ROC on the upside just like 2013 as PCLN peels away from its long term character.
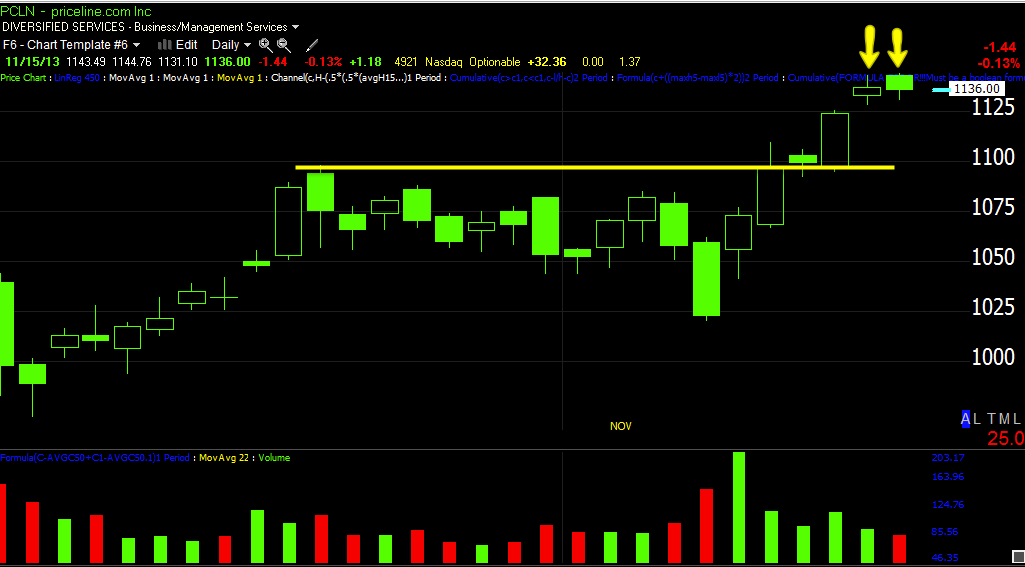
 This is why I said I'd wait until PCLN was >$1100, the range was that obvious as a head fake area.

I said I wanted to see something like a Doji or a Star candle after Wednesday's strong candle, we got a star yesterday which helps create the reversal process and is a well known reversal candlestick and yesterday as you can see above I wanted to see another to give the top area a wider/rounding area as "V" shape reversals are uncommon and unreliable, today we have another star so far, but since it gapped up, if it closes significantly lower we have a confirmed reversal pattern.

 The 10/9 cycle
1 Is the start of the cycle like the rest of the market, this is why I always say the market is the most important thing in picking a stock and people get it backwards, the market has about 66% of the influence over any given stock's movement any given day.
2 The down channel made for an easy head fake area and channel buster.
3 Is the first Channel Buster sending price BELOW the Channel
4 Creates the second Channel Buster and these are used for reversal momentum
5&6 Is the Bull Pennant from the Channel Buster, but also the start of the head fake move. We showed charts that PCLN would break out from this pattern to the upside and it happened 45 mins. later.
7 This is the fulfillment of the breakout above the range, the head fake move.

 Here you can see how the candlesticks of the last 2 days have helped create a more rounding reversal rather than a "V" shaped one.

 Long term Money Stream with a negative divegrence/distribution around min 2012.

 Daily 3C shows the same distribution mid-2012 and in to 2013 even worse, this is a large, long multi-year trend, it takes time to unwind such large positions without knocking price down.

Each indicator above is constructed completely different so they would not show the same thing unless it was there.

 60 min chart in to the head fake/ Channel area, a slight positive sending PCLN up at the second Channel Buster, exactly where it would be expected as that is a momentum generator.

 5 min negative in to the head fake area.

This is in leading negative position, but I;d prefer to see 3C leading negative to the downside.

The intraday 1 min chart

A close up of the same suggesting a pop in to the close, but it's a very weak signal.

The 3 min negative at the channel and even more so (distribution is heavier in to higher prices) as the head fake move is made.

There's plenty of confirmation to call this a head fake move.

Ultimately other than the 5 min, I'd like to see this 2 min chart also lead negative clearly like the IWM or VXX, jumping off the chart.

If you want more confirmation and play it safer, the Trend Channel has held the entire 2013 trend without a single stop out, a stop out (now at $1021) on a close would show a huge change in character and it's VERY unlikely PCLN would come back from such a break.

Often price will bounce around or loiter after the channel is broken, but they almost never come back especially with a trend this long.

Market Update Charts

These are just the averages and the VXX / VIX Futures, I'll cover some others in another post as these move so quickly.

There's significant damage done that is consistent with a head fake move.

This is the head fake area, it's in the right place, the nearly 2.5 trading weeks of range makes it the most obvious area to shoot for and it creates our "Chimney".

It's my gut feeling from the 3C charts that the serious damage is done, the negatives are confirming a head fake move, but around 2 p.m. or so, it looks like the market will try to ramp. I mention this often, in my experience after an op-ex pin wears off around 2 p.m., price can do anything, it's the 3C charts that actually pick up where they left off on Friday, not price.

So I'm thinking we will see an afternoon or closing ramp, but the damage is done at the head fake area. My next post will either solidify/confirm this view or not.

SPY
 10 min with a very sharp leading negative divegrence, this is typical of a head fake move ending, the speed and depth of the divergence on a strong chart.

This is the entire 10/9 cycle from accumulation to mark up to distribution and top with the head fake which is the typical transition to decline.. 3C is at a  new low for the entirety of the chart while prices are on the other end, that's a big divergence.

The 5 min chart also falling off VERY fast when zoomed in to intraday.

3 min in the head fake area confirming distribution which helps us identify a head fake move vs a real breakout.

The 1 min is leading negative, but see the intraday positive in white, it's very insignificant in the big picture, but it can be very significant in price movement this afternoon if that's all you are looking at.

QQQ
 15 min showing that same fast decline in the head fake area

10 min chart doing the same

2 min chart is leading negative overall, but this is that same intraday positive divergence I suspect will cause some upside after the 2 p.m. pin passes (2 pm is an estimate, not an actual time for option expiration, but by then, most contracts are wrapped up.)

IWM
 IWM 30 min without the channel shows a leading negative divegrence

 15 min chart with the channel, a clear leading negative divegrence and a big move today alone

The 5 min chart at the Oct. 9 cycle and the channel buster in yellow with a leading negative divergence/distribution, this should make for a great example of Channel Busters.

 2 min intraday falling off fast intraday, the IWM may not see the same attempt to ramp in to the afternoon.

The 1 min chart shows the same thing, including the probability for afternoon action, I like SRTY long as a short play for IWM, if IWM can bounce in the afternoon, then I may consider a put option.

 IWM 1 min intraday not looking good

Index Futures
 ES 5 min leading negative, but like SPY a small intraday positive in to the afternoon?

NQ leading negative

TF intraday, also showing intraday weakness for the R2K, looks to be the laggard for an afternoon ramp

VIX/VXX
 This leading positive started suddenly late yesterday, I suspect China was part of it as they were last time and the same thing happened last time they withheld liquidity and it was this time the next day (Friday), EXACTLY like today.

 3 min leading UVXY / VXX

10 min large leading.

15 min leading VIX Futures, there seems to be a REAL reach for protection and a strong one. 

Even 60 min VIX Futures leading positive starting yesterday, again, a VERY strong signal, it looks like a lot of fear.

Quick Market Update

I may open an index/average put like SPY or IWM, probably SPY.

There's a lot of weakness and although it's not past 2 p.m. when most contracts are settled and the pin comes undone (this is the time price can do anything, but the 3C signals almost always pick up on Monday right where they left off today), I'm going to try to get charts out (I will, just how many) because this weakness is developing faster than I can get through a watchlist.

I think SPY and IWM appear to be weakest.

I'll have charts out momentarily.

MCP Update - Core Long Position

MCP was last updated Monday of this week, MCP Long Position Update. After doing what was expected (a shake out <$4.70), I added to the core long position (as it was intended to be a phased in entry) and the average price for the position is now at $4.77 which is excellent for the long term core position.

Here's what we have now... It looks like the head-fake moves (Just a massive stop-clearing effort) are all in, there's no utility in moving much lower because there aren't likely to be any "nests" of stops left as the $4.70 area I was looking for was the 2013 intraday low. So we have a position now at an excellent entry point, very high probability, very low risk.

 This was the long term Ascending Triangle base, when triangles are this big, they are not consolidation/continuation patterns, they function as tops and bottoms. 

Then GS came out with a downgrade...
 MCP was sent lower, volume swelled which created supply, who do you think might have been absorbing that supply on the cheap because someone is on the other side of the trade? My guess is Goldman Sachs for a long term position, not a bounce play.

In yellow are the 3 stop areas I was looking for to be cleared, check the post linked above and the links to former posts, we identified all of these levels in advance including the last one of $4.70, the 2013 intraday low. The price pattern is now a large rectangle which is fine.

 Note the Bollinger Bands squeezing indicating a highly directional move is likely very soon. My custom DeMark Inspired Buy/Sell Indicator has flashed 3 buy signals in this area of stop runs, with the BB squeeze, I'd say on that alone we have a 75% chance of an upside breakout. Add the 3C signals and I think this is a home run.

 This is the large triangle area with distribution sending prices down to lower levels where they were accumulated, the $6.25-$6.50 level is the first and with 3C, the first area of accumulation is almost always surpassed by the reversal move.

Then after the GS downgrade, the accumulation went stronger to Leading positive divergences, again there was plenty of supply so seeing stronger signals makes sense as more supply would be accumulated.

 The 30 min chart shows the exact same accumulation areas in what I'd easily term a STAGE 1 BASE (accumulation).


 Here's the 5 min chart's leading positive divegrence as price breaks down from the ascending triangle on the GS downgrade and 3C leads as volume increases on the break and at least 3 stop runs.

 This is the more recent action around the $4.70 level, this is an important area for the initial reversal .  Note the increasing ROC in the leading positive divegrence.

 I'd say this is the reversal process and it looks to be mature, more than half done and the second half is much shorter.

I use a moving average to show the same rounding bottom.

I figured based on a "Measured Move", MCP likely has a target of at least ($6.50 based on 3C accumulation alone) $11.25 just based on the base's measured move.


GOLD / GLD Update

I would prefer to either see GLD ( gold) get on with a pullback/gap fill or really tell us something is wrong as it is a QE asset rather than sit idly and chew up theta. Gold typically rises with QE, but more importantly it rises with inflation expectations. Falling gold has typically been associated with QE-OFF / TAPER-ON sentiment among market participants so it's something to pay attention to.

Yesterday I decided to hold GLD and GDX December calls as it looked like the most probable outcome was for a filling of yesterday's gap up and a continuation higher, it took most of the day to get there so I'll be watching equally as close today, I'd rather take a small loss now than a large one later if that's what the charts are pointing to as the highest probability or a reasonable probability.

Right now, GLD looks like this...
 Yesterday it seemed GLD got a late day temporary reprieve as the 5 min chart led GLD higher with a positive divegrence in the afternoon.

Since then however, this 1 min chart shows the move from yesterday afternoon and a small negative divegrence this morning that "seems" to be building.

This is the troublesome 3 min chart from yesterday, it still looks bad so if the 5 min divergence which was rather small and already fulfilled in price movement continues to go more negative, once again it will be a decision as to whether it looks like a shallow gap fill pullback in which case I'd be ok with holding the December GLD calls or if it looks more serious for a deeper base building pullback which would be nice for GLD's longer term trend, but would chew up calls.

I'll check on GDX as well, but they're usually not too different and I'd think gold would likely lead GDX at this point.

Liking IWM short or SRTY long

I would add to the SRTY 3x leveraged short Russell 2000 if I had not already added and if there were any advantage which there is not as the position is flat at break-even, but it does look like IWM is going to give us that nice Channel Buster Example I can use for a Resources and Concepts post.

 IWM downtrend Channel Buster looks ready to fail (A type of head fake move).

 The intraday 1 min is not looking good as IWM underperforms again today.

And a zoomed in look at the 15 min chart shows it too has flipped and we have some bearish engulfing candles on timeframes from 15 to 60 minute.

If I didn't have a position, I'd enter SRTY in this area or perhaps TWM (both long). 

If there's a decent intraday pop (set up), I may consider some IWM puts.

SPX 1800 / China Liquidity Crisis and QE for EVERYONE

It was a busy night with the Nikkei having a huge run after the failed Abe / Kuroda (QE-Zilla) has failed to turn the economy even a bit (kind of like here in the US) so the assumption is, if a lot doesn't work (and remember, their QE was to double their monetary base in 2 years), then more must be even more useless, or maybe they just need to make it a bit bigger for it to work.

In any case, we have the ECB hinting at QE very openly, Yellen is as dovish as they come and Japan who will not be outdone in the size and scope of Quantitative Easing, looks set to unleash even more.

However there's one country that's not taking part in the liquidity overflow game and that is China, once again as we saw in October and the market didn't care for very their liquidity draining stance much, China has once again refused to inject liquidity in to their system at Thursday's regularly scheduled Open Market Operation, Reverse Repo, NOTHING.

As a result of China draining liquidity on the whole for the week, the overnight repo rate spiked to 5.32%, it's nothing like the 10% June rates last time China REALLY tightened down and drained liquidity, but it is the biggest 2-day jump since then as smaller Chinese banks scramble for liquidity.

It seems to me the last time this happened in Chine Shanghai Real estate had jumped by something like 11% in a week, China had started rocking the boat with Japan at the same time over the Senkaku Islands which is China's go to play every time they have trouble with Japanese hot money flows causing inflation in China, especially in real estate (remember the big clash over the Islands that left every Toyota dealership in China either spray-pained or with rocks through their windows?)

While it seems the S&P Futures are being drug toward 1800 like a tractor beam, China is apparently letting the world know what it will do if the world makes good on all of these QE noises that sends hot money pouring in to China and thus inflation soaring. I'd say China is firing warning shots, but as they do so, the smaller banks are having trouble finding funds on surging overnight repo rates.

The last time this happened in October, the next day there were a string of very strange events and cracks in numerous areas, VIX Futures were bid heavily, protection was being sought and Credit markets haven't recovered since then, it will be interesting to see how far China goes this time (in October they skipped 3 regularly scheduled liquidity injections on a bi-weekly Tuesday/Thursday schedule).

In the US this morning, Industrial Production declined by -0.1% in October from the upwardly revised 0.7% increase in September.

So here we go on a Friday Max Pain Op-Ex operation day, expect volatility around 2 p.m. until then it will be interesting to see if we see any of the same distress signals in areas like VIX futures and a drop in credit as we saw last time China tightened and as we saw yesterday afternoon.