Friday, December 20, 2013

Went with VXX Jan $43 Calls

Trade Ideas: VXX / UVXY Long

I'm  going to open the UVXY long back up in the trading (equities only) portfolio and open a Feb Call position in VXX in the options tracking port. I'm not sure about the exact strike, but in the money calls.

Market Update & Leading Indicators

I have to get this out quick, I think you'll know what most of it is.
 Most importantly, SPY intraday and a little chimney.

 QQQ intraday.

And they did all of this with ZERO Arbitrage and ZERO Carry support, you'll see when you see HYG Credit and the Yen today, that tells you there was some brute force and it must have really been worth it, I imagine so with all 4 option types expiring, actually 5 if you want to count weeklies which cause pins on their own.

The VIX (spot) BB Squeeze now has a reasonable reversal process, it can move north from here with that process in place.

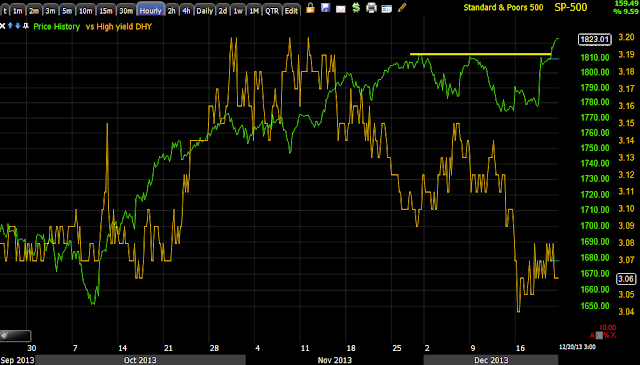
This is HYG Credit intraday! You'd think I inverted its price, CREDIT WANTS NOTHING TO DO WITH THIS QUAD EXPIRATION RUN, this is also why there's no SPY Arbitrage available to help.

This is credit (HYG) through the 5 week range, notice anything as the range progresses?

 I said way back then that the May 22nd Key 1-day reversal was a big deal, it will be studied in the history of this market as a key area where something changed. I think smart money was told about the taper because it was just after in June when we got the taper reaction with the 100 bp move in the 10-year yield.

Credit NEVER recovered, never went risk on with stocks and credit markets are a whole lot smarter than stock markets.

The area of most trouble I have been pointing out for a month or so was off the initial highs of the Oct 9 cycle, the run above those highs has been really ugly in all indicators, way off the charts from anything I've seen.

This High Yield Credit today, the risk on asset is not willing to take any risk with stocks, in fact the opposite,

Look at HY Credit during the range, similar to HYG, what does that tell you. The more I see, the more I think the big boys were alerted that December was D-Day.

Again HY credit around that May 22 Key Reversal day.

This is why the market is getting XERO carry support, as I published last night, the Yen positive divegrence  has kept the carry trades in the garage.

Look at the 15 min, this is what I published last night. For there to be a divergence this big and fat in the Yen, there was major buying or closing the carry trade, ironic the BAC comes out this morning and says they just closed the USD/JPY carry? That has to end with repurchasing or purchasing rather, the Yen, exactly what we see in the divergence above.

This also tells you a lot about the market if the leverage of carry is being shut down.

Sentiment from pro traders the last 2-days, they aren't willing to take the risk either.

This indicator has been leading, calling tops and bottoms and what is it doing now?

Take a longer look...

Sentiment...Uh-Oh...

Our other version, Recall the Oct 9 cycle and what I have called the worst looking area, the move above the cycle highs.

This is yields reversion to the mean, yields are no longer exerting any magnetic pull for the SPX.

QQQ / SQQQ Update

Just as I was capturing and notating the charts for this update, what I'm looking for may be starting to happen.
As I've shown numerous times, 3C signals on REGULAR hour charts (not futures unless they're 5 min or longer) tend to pick up right where they closed the next trading day whether it's the next day or over the weekend.

Also as we talk about every Friday, most option contracts are wrapped up by 2 p.m., this means price doesn't have to stay pinned at the optimal "Max Pain" level and it's free to do what it wants after 2-2:30 p.m. on Friday, however it's not price that I'm concerned with the last 2 hours, it's the 3C signals, those are what are most likely to pick up where they left off at today's close.

So I'm looking at a long SQQQ position for the trading portfolio (3x short QQQ), but as you'll see, I'm looking for 1 thing to happen and just as I started writing this, it looked like it might be starting, we'll see.


 The Q's have broken the closing high, they are just above the intraday high at $86.53, the volume is pretty poor, you should see the TICK, it's even worse. If I had the time I'd pull up my NDX breadth indicators, but I don't have time with everything else I'm watching.

Intraday this is the QQQ, what does that look like to you? A TEXTBOOK reversal PROCESS, as I'm adamant about, reversals are a process, not an event except in a parabolic move, but they still have some process to them and the process is almost always proportionate to the preceding move, this is beautiful, but what do I look for?

An Igloo shape with a Chimney on the right", the chimney is the last minute head fake move that is typically seen right before e reversal (that is proportionate too, a head fake on a 5 min chart reverses faster than one on a daily chart).

3C looks great here, the chimney and a continuing divegrence would give me a high probability, low cost, low risk entry in SQQQ.

This is SQQQ, note the same reversal process, although this is the inverse with 3x leverage, so the chimney would be a low just below the intraday low, the 2-4 p.m. timeframe is the perfect time to do that as there's no more need for a pin.

 There's migration in the divergence too, whether looking at the Q's, the 2 or 3 x leveraged ETFs , bull or bear.

And the minimum timeframe I look for to open a position, the 5 min which I consider to be the first that shows true institutional intraday action, so this leading negative is beautiful, the price pattern thus far is beautiful. I just need to set some alerts.

There are several other assets that look just like this.

For those looking at PCLN, remember >$1200 is the area, but there's a really flat range, I'm guessing that's its pin for op-ex max pain, keep an eye on that one too.

Trade Idea: QQQ Feb (22nd) $87 Puts

I'll be opening a full options position in Feb (monthly) $87 Puts right now.

Market Update

Again, it seems the market couldnn't be much more predictable, take the IWM, the asset with the most work to do, the Q's with the second most...

The gains for today, DIA +.33%, and it easily hit the range and crushed it.

QQQ which had the second most work to do, up +.79% and just broke the range

SPY which doesn't have much work to do at all, up only +.0.20%

The IWM with the nMOST work to do, the one asset most traders would have thought, "This isn't breaking the range", up +1.47%!!!

Either that's MAJOR market dispersion from +.20 to +1.47 or if you simply look at the charts, it's Quad Witching options expiration, what do you think? It's pretty easy to see from price alone.

Look at the IWM since crossing the range closing highs.
 IWM crosses the "CLOSING" range highs on very little volume considering the move, watch what happens to 3C that was "Rising in agony"...

We start to go negative, mission accomplished, it just needs to be held there until those contracts cry uncle and close out . Typically most traders watch the closing high, not the intraday high.

IWM 2 min was rising in agony, now the negative divegrence is migrating, it has a sharp leading negative AT THE EXACT SPOT WHERE IT CROSSES THE MAX-PAIN THRESHOLD!

YOU DON'T EVEN NEED 3C FOR THIS, YOU KUST NEED TO KNOW IT'S QUADRUPLE WITCHING (QUAD OPTIONS EXPIRATION)

Chart examples

If you need to, go back to the last post and look at the range for DIA and where price is right now and the range for the IWM and where price is right now and what I said about the DIA not needing to struggle and looking the worst on 3C and IWM looking the best, also the VXX action and HYG.

Again, the concept of 4-5 trading weeks of range and probabilities from a technical trader's view, "The trend is your friend", what is the trend over 5 trading weeks?

Thus, what trend are you going to play and where do you think max pain is on the last and largest Options expiration with Quadruple Witching today?

 As mentioned, VXX / UVXY were accumulated right on the open, but as they neared break-even, note the small negative divegrence on a 1 oin chart, yet it stays bid because the correlation isn't falling.

 2 min VXX, also accumulated on the open- THIS IS WHERE I SHOULD HAVE ADDED THE SECOND HALF OF THE POSITION, BUT I DON'T LIKE A.M. TRADE AND I WANT TO SEE WHAT THE MARKET LOOKS LIKE AFTER A.M. TRADE HAS PASSED.

However as far as large accumulation, this 15 min chart of UVXY is right at that level in which I'd consider it to be screaming, the kind of chart I DON'T ignore. Even with the distribution to steer VXX intraday, we've added more to the divergence today.

HYG on the other hand is seeing distribution.

2 min HYG so there's migration of the intraday divergence.

 As for High Yield Credit that has no Arbitrage correlation (red) vs the SPY (green)...
 It's dropping today, but this is nothing compared to what it has done while we've been in the range.

 This 60 min chart shows you what HY Credit has done while in the range, what do you make of Smart money's take on the market here?

"Credit leads, equities follow".

As I said earlier, my market update notes were clear, DIA 3C underlying trade looks the worst, IWM looks the best, that has to do with where each is relative to their range, the DIA has already kicked those contracts in to the "Expired worthless" bin, the IWM would have the largest payoff so I think they'll work hard to force IWM options to expire worthless.

DIA 1 min above, compare to IWM 1 min below, and I'm not saying IWM is strong in any way other than them working it today...

IWM 1 min

DIA 2 min

IWM 1 min, you can see 3C is rising in agony.

DIA 5 min, why not distribute/sell/sell short up here, mission accomplished for option expiration, but as far as the IWM's 5 min...

Again, rising, but in agony, there was a clear 3C down trend and they are pushing it with all they have today within reason to cause retail options to expire worthless and the ones they wrote to come in at a handsome profit.

For this reason, I expect the last hour of today to likely be very busy with positioning new positions.

Market Update-Quad Witching

There's clear intention this morning to try to move the market higher, there isn't so much clear intention in the way of accumulating and then moving the market higher as in a cycle, this seems to be tied very clearly to Quad Witching.

If I'm playing options and I look at this chart, what kind of strategy do you think I'm going to chose? Based on PRICE ALONE, where are the highest probabilities and you can't look at this in the way we generally play options, straight buying puts or calls, these are slightly more sophisticated, but just slightly...
 Above you have over 5 trading weeks in a range, if you are dealing in options, what is the highest probability outcome looking at price, forget the concept of a head fake move above a clear defined level of resistance? I'm playing the range in any number of different ways, but we aren't looking at this from "our" perspective, we are looking at it from a "Follow the moving average, price is king, Marty Zweig is my idol" perspective. In that case, you're going to play the range and almost all options can play this , even the single stock options. Look at the volume today, does it really seem like a risk on move considering Q3 GDP just blew away consensus and makes tapering at the next meeting all the more likely? 

No, this is Quad-Witching.


 The Q's have the same range, it's 4 trading weeks old

The R2K has the furthest to go, but it's also probably one of the most profitable max-pain pins to shoot for because it would seem to be the safest from an options trader's point of view, "Ah, that former high isn't going to be taken out, look how bad the IWM has been lagging the market!"


The Dow is a perfect example of making those options worthless, with that move, they are gone.

This is most likely why, in my market update notes I have "DIA has the weakest current 3C trade and IWM has the strongest", it makes perfect sense, the DIA already crushed those positions, they don't need to support it, they can in fact start selling short in to it as long as they maintain price above the resistance level long enough for those options to close, usually by 2 p,m,

The IWM would look the strongest as it has the most work to do.

This same action is in XLK,  XLF especially because it's so close and several others that have that same range bound look and it's not just a week, we are talking about 5 trading weeks.

This may very well be a gift today or Monday, it depends on if they keep acting or start acting like the DIA.

The VXX has purposefully been knocked down, but there's a strong bid under it, I'll likely add to it soon, just look at it vs the market and HYG has been activated as well today, why do you think that is, ESPECIALLY when we get such strong Q3 final data, that's "GOOD NEWS IS BAD NEWS", but it doesn't matter because today is Quad Witching, 4 groups of options types all expiring on the same day.

Regardless of knocking VXX down at neutral on the day, they can't get enough traction to activate the SPY arb as of yet.

So the key is still VXX / UVXY, however the opportunities are likely going to be everywhere.

More in a moment.

Trade Idea: Reiterating MCP Long

I thought MCP may take a breather and consolidate a bit, but it seems to be straightening itself out each day more and more. There's already huge leading divergences (positive) in the areas where it ultimately counts (30-60 min), it was the 5 min and intermediate intraday ranges where it looked like it may consolidate, but the intraday charts have been nearly tick for tick confirmation so I want to reiterate MCP long which is in the trading portfolio, also as a longer term trade and an options position (call).

Morning Update

There's quite a bit to wrap our heads around this morning, almost all of it we have warned about in the last month and a lot of it just last night. Where to start?

First the Carry Trades as they may have a significant impact on the market. In last night's Daily Wrap, I warned of the JPY single currency positive divergence and said,

"All of the carry trades (JPY-based) stalled out today as well, and most are sitting in near perfect symmetrical triangles, we know what that generally means so watch the EUR/JPY especially for a possible head fake move, after that if it is a head fake move, that would have severe implications for the carry trades and thus for the Yen as an unwind would be highly likely."

Take a look at the Yen, the divergence was posted last yesterday, but I did think it would take a bit longer to develop.

 This is the single currency Yen positive divergence, it looks like the carry trades may be about to be covered.

Last night I warned of the symmetrical triangles in most carry pairs and "You know what that means", which means a head fake breakout to the upside followed by a rapid downside move.

Take a look at the USD/JP overnight and today...

 This was one of the less symmetrical triangles, but still a bull pennant type of pattern, there was an upside breakout at which point BAC this morning closed their long! The result?

This is the USD/JPY this morning.

Here's a wider view of the pair. Target according to BAC, 96-97 through the psychological 100, what happens at the BOJ at that point may just start the Chinese/Japanese conflict for real, especially with China's possible banking sector implosion-more on that.

I can''t say this is responsible for the Nikkei, but I warned about the Nikkei last night as well,

"While the Nikkei has a sloppy in line 1-5 min 3C chart, where it really counts and accrues, the 15  min chart, also seems to agree with the Yen or at least be aware of it."

And I showed this negative divegrence in the Nikkei 225 futures as of last night
15 min leading negative. I'm not sure we've seen the last of this and there's more going on in Asia, but...

The Nikkei id down -.40% which is far batter than some other Asian averages.

I think my warning last night about watching the Yen and the carry pairs is something we really better watch the next few days, if what I suspect is right, then BAC is just the first to come out an admit they just unwound their carry trade and that doesn't have good implications for the US stock market.

I also have been warning and keeping an eye on the Chinese liquidity situation/inflation situation in which the PBoC is either withholding reverse repos that are regularly scheduled Tuesday/Thursday or as we just saw, they injected $300 bn Yuan through 7-day reverse repos the last 3-days as the interbank liquidity surged, then dropped -2% on the injections and then promptly surged to 9% which is the highest seen since the June (near) interbank liquidity crash/money markets.

Things are heating up which means watch for headlines this weekend of military hostilities between Japan and China or intense rhetoric over the barren rocky islands. The Shanghai Comp was down 1% and down for the 9th day in a row ! The situation with interbank liquidity is always hectic at year's end because of legal needs that need to be in place, but this has smelled like something else for months and back to June.

The EU was downgraded overnight by the S&P from AAa to AA+ so the love is being spread everywhere.

Finally the final US Q3 GDP came in blowing away consensus us 3.6 and prior of 3.6 for a final print of 4.1, very handy for the F_E_D to cut another $10bn next meeting. That means from the 1st Q3 GDP estimate to the final, there has been a discrepancy and gain of 45%. Seems a bit out of whack, no?

So although it's volatile Quad Witching and year end window dressing, there are some very serious events not on the horizon, but in port right now, beware and keep an eye on these, all of them.

So lets see what the market looks like as am trade burns off.