Monday, December 23, 2013

Market Update

First let me tell you I have to leave at about 3:45 to be at a 4p.m. Dr.'s appointment with a plastic surgeon, this was the best appointment I could get to miss the least market time and had to wait 2 weeks rather than take one 2 weeks ago in the middle of the day. I think I mentioned this, I had something cut off my face about 4 weeks ago or so and the biopsy came back as skin cancer, it's not a big deal except for the fact it's about a half inch under my eye, anywhere else and the scar isn't a big deal.

I think I have some surprise coming because we were suppose to just schedule the Mohs procedure after the biopsy came back in case it was cancer, however after it came back, they skipped scheduling the procedure and said they wanted me to meet with the surgeon to discuss "My options", so I'm not sure what that's about, but I'm more worried about missing the last 15 minutes of the market honestly, at least right now!

So I'm looking at the market, there are plenty of negative signals and price coming apart here and there and I'm seriously considering a position, options or I have room in the trading portfolio to fill out the half size FAZ and SPXU positions, but I have a gut feeling, I can't quantify it or give you an objective perspective in charts, other than to show you these few.

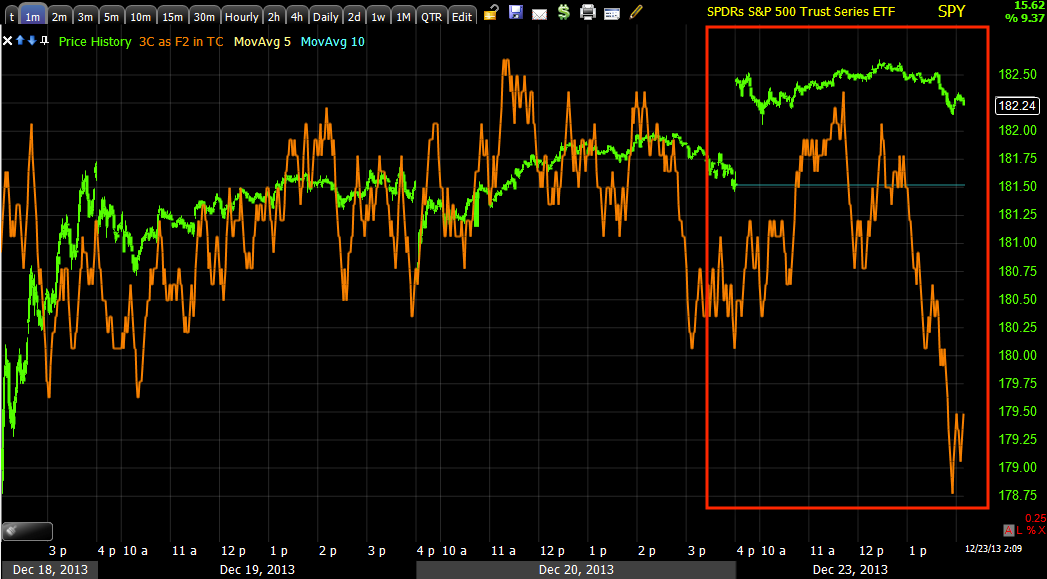
My gut feeling is that this negative divegrence which you can see below in the SPY (which has grown quite bad today) is going to get much bigger, as in "Screaming".

 SPY intraday 1 min leading negative quite badly, well below last Thursday/Friday and that developed quickly today.

 As I said, the strength today was only skin deep ( 1 min charts) as this 2 min was already negative, never confirmed or even tried today and just got worse, well below any reading for more than 4 weeks, likely more.

5 min, again it's really interesting with that positive we saw just before the FOMC and kept out longs until after and even entered a new 3x long position just before the FOMC, but right in to the gains, distribution of them and continuing in to Quad Witching.

 10 min with progressively worse divergences at about equal tops except the very last one, I usually highlight head fakes in yellow boxes.

Today's TICK, it only hit +1000 and now it's clearly turning down and has hit -1000. TICK should be hitting +1250-+1500 on a day like today, but nada. I look forward to tonight's breadth readings.

 The 5 min Index futures are exactly where I want them to enter trading shorts or tactical entries for longer term  positions.

I feel like this is going to get worse.

This really got me, the CBOE SKEw Index (they put out the VIX as well).

According to the CBOE, the highest the SKEW has hit (the higher the more chance of a black Swan market crash) Oct 1998 in the middle of the Russian Crisis, to which the F_E_D launched a massive Surprise Cut in both the Fed Funds and Discount rate to counter what was about to happen, that reading was 146.88, we are at 143.19. Another was the July 1990 recession, SKEW was elevated just before in June, so this SKEW reading or Black Swan Index is really at a very high level historically.

I have no problems with the open positions, I'd have no problems adding them today, but before I add the last half to these or open options, I want to see if my gut is right on this one. I would suspect that we'd see something very ugly right before a major move and I want to give the market the time to do that.

If objective data changes my mind or reinforces the gut feeling, I'll of course post it, but watching how things are going, I just get a more ominous feeling than just the normal 5 min negative index futures and other signals, I'M LOOKING FOR/ OR SUSPECT SOMETHING SPECIAL.

Other Interesting Assets

In the trading portfolio I'm running a little bigger than I'd like, normally I feel I can diversify enough with 6 positions, why make myself crazy tracking 20 when that's "Modern Portfolio Theory" which I'd call "Over-diversification", but Wall Street had to sell it to sell one of their most popular products at the time which most of you probably had at one point or another from your job, the MUTUAL FUND, different than a hedge fund. MF's are mainly long only funds, thus some of you may have taken a really bad beating in them at some point and sold at the bottom.

By law Mutual Funds can't invest more than 5% in any one position so they must have at least 20 positions (5% x 20=100%), this is also where the (I'll say myth) of over-diversification came from. Unlike Hedge Funds that can do just about whatever they want, but you can't be part of one unless you are an "Accredited Investor", Mutual Funds had to sell the notion of this larger diversification to sell the concept of their funds from a regulatory standpoint.

Many do not believe in modern portfolio theory anymore, I think it depends on your individual circumstance, but for me, it's too much.

So the positions open in the trading portfolio, which as of now has hit every swing whether we were long or short, are now positioned largely short with a few longs.

In actuality, EVERY position is long, some though are inverse ETFs or bear ETFs, so the positions are (all long):

MCP
SPXU (3x short SPX)
SQQQ (3x short NASDAQ 100)
UVXY (2x long VIX Short Term Futures)
FAZ (3x short Financials)
IOC
DGAZ (3x short Natural Gas), a play on a UNG pullback.

That's 7 posiitons, about as big as I'd want to be in a trading portfolio (personal preference) and there are longs like IOC and MCP mixed in with the shorts. Typically if I'm bearish (trading) I'll want 75% of the portfolio short and 25% long or cash and vice versa for bullish.

As far as other positions that look interesting as I went through the watchlist...

XLK (Tech) short, I like TECS (long) 3x short Technology) as a play there or just short XLK or get puts.

XLF also is not looking too hot, (Financials), the open position there is FAZ which is 3x short Financials.

AMZN is showing some interesting weakness.

In the Financial arena, GS is showing some weakness 

IOC looks interesting still as a long

GOOG looks interesting as a short, but I'm not sold on it beyond a trade at this point for new positions, I'd like to see some intermediate charts shape up or rather deteriorate more.

UNG is looking more like a pullback, but long term I love it so DGAZ is what I chose for that play (3x short natural gas).

SLV looks interesting, I'm keeping a close eye on that one.

MCP long still looks good.

SQQQ long (3x short QQQ) which is an open position.

PCLN has my interest, I'm just having a real hard time biting while it hasn't broke above $1200.

Transports are looking soft, IYT is a play on transports, you'd have to short it.

FXP which is "Short China" I like a lot, I'd love to see a pullback there. 

I'll let you know what else comes up, I wanted to get a few of those out because I know some of you have positions in the above.

STILL BEING PATIENT

Quick Averages Update

All of the averages are also going negative intraday (the only place they are positive), that includes the SPY, QQQ, DIA and even the IWM just made it's first jog to the downside and away from price, so this is looking better and better.

And There goes VIX FUTURES (not spot or short term futures)

These are the real deal, not the derivatives, these are the real VIX futures so this is one of the signs we want to see along with others that have started.

The lows in VIX futures are being sharply accumulated, or a reach for protection.

Hypothetically, the trade I'd probably be most interested in (well let me say with the way the Spot VIX looks, I would want and do have a UVXY long trading position that can be used as a swing long) would be VXX calls or perhaps IWM puts, it depends on where the best signals are and the best discounted premium, obviously with VXX down, the calls are going to be at a discount to prices Friday.

The optimal set up is the VIX stays rather flat or creates the reversal process which need not be very big for this morning's move, WHILE THE DIVERGENCES MOVE UP VERY STRONGLY LIKE THIS AND THROUGH LONGER TIMEFRAMES.

We have a view of the underlying trade, but price would still be at the same level and the options discounted, so we'd know the probabilities are very high for the reversal, but we can still enter at a discounted price which helps on the risk side too to lower your trade risk.

Conversely the same, but opposite could be done with a number of assets, but say IWM, we'd want to see deep leading negatives as IWM is either moving up or just losing momentum, but before it makes a reversal down.

The same could be applied to Industry groups like Financials, Tech or even individual stocks, it depends on where the best looking set ups are.

In any case, the above chart is nothing but good news for the set up we are looking at and it has gained quite a bit more since I started this post.

Market Update

Early there was some support from JPY crosses, they have lost momentum and are pretty much lateral, I'm suspecting that's what the SPY Arb is about, but it too is now getting interesting and potentially some trade opportunities. This is why I try to be patient, the first thing you see is usually far from the last during the trading day.

So we know about the JPY Crosses, for now they are no longer of any help. What will be interesting or valuable is to see how they and the Yen react as the day moves along.

SPY arb is pretty darn obvious and running at a +$.60 differential which is carrying about 2/3rds of it's movement today. VIX short term futures held up amazingly well this morning while HYG was moving up, it seems like an HYG Arb alone was being tried, it wasn't getting the job doen (TLT looks pretty strong in here, very good confirmation so I doubt it could be used in the SPY Arb), then suddenly as if out of nowhere, VIX short term futures drop EXACTLY to reversion to the mean of their correlation with the SPX.

However, there's movement in HYG already on the negative side in a flat range.

The trade that looks like it might have the best chance is VXX calls or long equity in that or UVXY, but I would wait and let them give their own strong signals and not just depend on the HYG signal.

For a quick explanation of how algos create this arbitrage trade, when HYG (High Yield credit, an institutional risk on position as opposed to Investment grade credit which is risk off or flight to safety)rises, algos simply look at it and say, "Smart money is buying" and the algos buy. There are 3 assets that make up the model that Capital Context uses, HYG, VXX and TLT. For a positive arbitrage (supporting market upside), HYG must go up, VXX and/or TLT go down. If one, like TLT is pretty flat as it is today, then the movement of the other two will determine the Arb.

For VXX the algos see the short term VIX futures as a flight to safety or reach for protection, so if VXX is moving up they algos interpret that as risk off and a flight to safety, they act in the same manner, sell, but if VXX drops, the algos interpret that as money flowing out of the safety trade and in to the risk on trade.

Bottom line, when HYG moves up combined with either VXX and/or TLT moving down, you have a positive Arbitrage that is market supportive. If HYG moves down and VXX and/or TLT move up, you have a flight to safety Arbitrage that is not supportive of market gains, but losses so keep that in mind when looking at the charts.

Remember, TLT is out of the game as it is flat and it doesn't look like it's going anywhere except maybe up as it has good confirmation, that would be a market negative as it looks like a run toward safety and away from risk.

 This is VXX vs an inverted SPX price in green so you can see the correlation which iss normally 1.0 meaning in a perfect world they'd move exactly opposite each other and when I invert the SPX's price as I have done above, they'd move exactly the same.

Early on today VXX would not move down as SPX moved up (seen as down here in green because I inverted price to make the correlation easier to see). Then all of the sudden VXX moves down quickly and right to the "reversion to the mean" or correlation (green box).

This helps move the Arbitrage positive, especially if TLT is down and/or HYG is up. HYG seems to have the most Arbitrage influence lately, but big picture for the year and especially since May, HYG is deeply dislocated from the market, in other words credit ha not bought this rally, they don't trust it.

 This is HYG (blue) High Yield Corporate Credit, a popular Smart Money risk on asset, notice the last several days it has been almost perfectly inverse or opposite the market, that is strange, it shows Credit is again, not buying or excited like equities, but this morning we have a very fast move nearly vertical in HYG which can be manipulated pretty easily for short bursts of time, not in the long run though as I mentioned it's already well below the SPX for the year which is a leading indication.


Here's where several different trade possibilities open up or start to... This is why we are patient, let it come to you.
 This is HYG intraday, you can see it moved up just like I showed you above vs the SPX which is market positive as the computers interpret that as smart money buying and follow along, but we already have a well developed intraday 1 min negative divegrence, this is where the new negative divergence would start, on the 1 minute chart and it is leading negative so pretty strong and also there's a flat area in price which is also where we typically see divergences.

To show it's strong or strengthening, it needs to migrate to longer timeframes, that shows there's heavier distribution (in this case), that's migration of the divergence and that's how we know the probability is the divergence is stronger and will effect price.

Ideally HYG would start making a decent short candidate or puts, but I don't like trading it for a couple of reasons, 1 is the beta is too low.


 The HYG 2 min chart, notice the divergence starts at the same area, that flat price range, so we have the first step of migration which also confirms the divergence as being stronger and not just a passing signal.

Now it's also making its way to the 3 min chart, so migration of the divergence is in effect and HYG is likely to come down if this keeps up.

That means VXX is likely to stabilize and start moving up and the Arbitrage is flipped on its head and the market loses support and has a good chance of losing ground.

This is where the trades are, especially for options because of the deeper moves which reduce the premium.

This is the delayed SPY Arb, it was activated around 10 with HYG, you can see it grew as VXX fell, it's worth about $.60 of the SPY's gains today, meaning it created about $.60 of the SPY's gains today.

From here the "possible trade" would be in VXX or UVXY, they can be equity, but because of the way it set up, I prefer options.

Or it can be as simple as a short Market ETF like long SDS or SPXU, but we want to wait and let VXX also give strong intraday confirmation along with HYG and ideally the intraday averages should as well.

I already see it in a few areas including Index futures.

 Like ES/SPX futures intraday and around the same time as HYG going negative.

In fact VXX is now going positive, but the signal needs to JUMP off the chart, which I suspect it will.

We also see it here as the SPY cannot confirm the upside on even a 2 min chart by this time in the day, so it seems the intraday support for this move is skin deep and without the Arbitrage to help, it could get in trouble quick, which makes for a nice options trade or you can go with an equity position, patience is still key here, we have a set up, but let it set up.


This is the SPY 5 min, this could have easily confirmed by now, it hasn't. The positive is RIGHT before the F_O_M_C, you may recall, this is why we entered longs an hour before the FOMC as well as held a full portfolio of trading longs.

Since then, not good and it gets worse after Friday's WQuad witching as did a number of assets and indicators as shown last night.

Not only are HYG and VXX important to watch for the set up, but probably the most important is the IWM, this was one average that did confirm on intraday charts in the morning as mentioned, this is the 2 min chart, no confirmation here, so again the move is pretty skin deep with only 1 min intraday charts in line, that's not much support.

However, this 1 min intraday chart in line with IWM is an excellent barometer of what's going on, when this goes negative along with the other assets mentioned, probabilities for a number of trades sky-rocket.

We have a start and a set up, we also have time so I say just keep being patient, let these charts jump off the screen and tell us to make a move.

MCP Update/Follow Up

MCP is a longer term long position that I have liked for a while, it has a huge base, it moves on its own, for instance Friday as the market was falling in to the close, MCP was popping, but it's more than that, it has just been putting in the time, doing the work to build a strong, sustainable base to launch from.

I have this in an open long trade, I can't add to it any more as it's at full size and a Call position, both are in the green.

The long term charts are beautiful, especially since Goldman came out with a little negative rating that sent MCP to the lower end of the base.

Today it's the 5 min chart grabbing my attention which is now starting to migrate or bleed over to the 10 min chart as well. If the intraday charts were not mushy and we had a bit of a pullback, I'd call this a really strong entry, I'd probably still call this a really strong entry.

What will be most interesting today is what happens with these 5/10 min charts, but I think it looks good so far.
 You can see how big the rectangle base is, it was an ascending triangle, not a consolidation though as it was way too big, but base until GS came out with a hit piece knocking it down, which tells me Goldman is 95% going long down here.

There's a "W" base in place, neither of the 2 individual bottoms in the "W" alone would be proportionate (big enough) for a reversal process I'd trust (there's a proportionality to these), but taken together the process is just about perfect. I really don't know and don't think we get another move down toward the lows, but looking at the bigger picture we are still very low in the rectangle.

This is the 30 min 3C chart (the 60 should have loaded first), the red arrow is Goldman's piece and look at 3C since then, that tells me GS is a likely buyer, you can pretty much do the exact opposite of whatever Goldman's sentiment is, it works like magic with their free trades, I think Tom Stoppler is 9 for 9 losses now on his calls (they are not dumb and they are not taking losses, they are creating opportunity with those trade red'ds).

GS is known as a firm that trades against their own clients so what do you think they are doing with these free trade ideas for the public, it's like the CEO on CNBC pumping his company while dumping his shares at the same exact time.

 Here's the 60 and the base, look at that leading positive on the GS call that sent it lower! I am very happy with the long there, there's not much risk placing a stop below the rectangle, although it's a very obvious place so you want to stay away from any obvious moving averages, whole numbers like $4.50, you don't want to be a penny under the lows or anything like that, even though I doubt it heads back down there.

Next up should be stage 2 and with a base this size, it should be a doozy. In effect, the head fake move (yellow) is already in, that's also what creates the momentum, see the last one on the upside and what happened next.


This is the 5 min chart I'm watching, there's accumulation at the lows, but also right here apparently just below the resistance of the smaller "W" base so I'm guessing MCP is gathering some energy for a breakout of the "W" resistance area right around $5.

I'll keep an eye on it because a pullback would be fantastic, but even without it, if that 5 min gets much more vertical, I'd likely open or add to the position (which I'm already at full size), but perhaps you may be interested.


Early Update

It's VERY tempting to act, but I hate to act this early. There's no opening confirmation in the SPY, QQQ and only 1 min confirmation in IWM and DIA, 2 min is negative and as bad as the SPY/QQQ.

Most of all, VXX hasn't hit a new low as you'd expect it to so protection is obviously bid, that's where I'm tempted to act or on an inverse ETF like QID/SQQQ, SDS/SPXU, but I'd rather not be hasty.

ES's 5 min chart is a good example of why I usually won't take a short trade unless there's a negative on that timeframe as it starts to lose momentum and altitude on the regular open with that 5 min negative in place.
ES 5 min, it's not just the negative, but when it started going negative and you see price bending now after the overnight session.

Also interestingly, so far TLT has confirmation early on and I say that because of the "supposed" fat finger trade in the long bond last night, a huge block in thin volume, a flight to safety and thus far the 20+ year TLT is in line or better this morning, as I said earlier, "I doubt that was a fat finger trade".

It's really the VXX/VIX futures that are really impressive as they hold up way better than they should.

There are a few other assets that are also looking very interesting and Industry groups, thus far there's ZERO confirmation in XLF (Financials) and XLK (Tech) and nada in AAPL. In fact I have stayed away from AAPL both long and short just waiting for timeframes to give a high probability position, the 15 min has been UGLY as sin for weeks, but that's about it, this morning 1, 2, 3 and 5min charts (about as far as I'd read at this time of day) are all negative/non-confirmation.

However it is still very early, I think it's best to be patient, let the a.m. trade burn off and double and triple check.


Index Futures Still Neg.

I don't mind the 10 point ES melt up in overnight volume, what would bother me is losing that 5 min divergence, luckily, it's still there.

Russell 2000 Futures 5 min negative, also in all Index Futures as last night and Friday.

A.M. Observation

Good morning.

Overnight futures melted up on very low volume apparently on AAPL concluding the deal with China Mobile which was assumed to be completed last week before we found out on Friday that it wasn't, it's not exactly new-news as this has been 6 years in the making, but nonetheless Tech traded up in Europe on the AAPL news, now lets see if it's a sell the news event which I'm guessing with a 6 year lead time on the rumor, it likely will be.

China is still having massive interbank liquidity problems as the 7-day repo hit all time seasonal record highs (as it tends to rise at the end of the year for regulatory reasons), but last night hit 980 basis points or 9.8%!!! The situation is so bad now that the Government has called on Chinese media to cool it or tone down stories on the liquidity crisis, if anyone remembers, this is what got the ball rolling in the US in 2008, it was because of subprime, but it was the lock up in interbank lending that created the Lehmans and Bear Stearns, not good news.

FX is more or less flat and boring still, the USD/JPY lost ground and broke $104, found some support, bounced, but still can't get back above $104 as the Yen slowly gained more ground.

Crude did pullback as I suspected last night, it found some support, but I expect a larger pullback, we'll check in to that early.

And  the big story of the long bond fat finger trade executed in large size in low liquidity sending it up from 130 to 135 instantly, kind of like some of the other strange , large block trades of the last week in the overnight. Had this occurred during regular hours, it's hard to see how it would not have crushed risk on sentiment. For now it is a mystery who put it in, if indeed it was a fat finger or something else, I have a little diffficulty believing it was a fat finger trade at that time of night.

As was said in last night's post, I'd rather see the market up early today than late today and so it shall be with about a 10 point rise in ES overnight on a low volume melt-up, however we'll see what happens in regular hours, there's usually 3 trends in the day, the overnight, opening and a.m. and afternoon that tend to all be distinct.

Key to watch, the Yen, the Chinese banking crisis, Carry Trades, Now the Long Bond and any longer dated bonds and gold which is looking to be stabilizing.


Sunday, December 22, 2013

The Week Ahead

I hope everyone had a nice weekend, not too hectic.

Honestly, when I look at the week ahead, it's really the rest of the month ahead, Wall St. types tale a lot of time where they can string days together. Being we have a half day Tuesday and a closed market Wednesday, I'd guess the higher ups left for the Hamptons last Friday and likely won't be back until the the following Monday (a week from tomorrow), the only problem with that is, will they come back for Monday and Tuesday when Tuesday is New Year's eve and Wednesday the market is closed again? The mid level people are likely going to cut out after Tuesday and be out the rest of the week.

I'm not sure whether to expect a very dull or very volatile rest of the month. If we go by the Spot Vix I showed Friday which has a pretty beautiful reversal process already in place and with the 4 hour leading positive in VIX futures that makes perfect sense with the VIX Bollinger Band squeeze, I'd guess that we are going to see big VIX upside volatility, which means downside market movement, however that runs counter to the "Santa Claus Rally" idea.

When I look at this market though, we had a knee jerk reaction (the market is all about perception- to what end is often the question) on the F_O_M_C day, we couldn't collect much data with Quad Witching (options expiration) this last Friday, only about 2 hours worth so this week I'll definitely be looking for the data as I don't just accept the "Santa Claus" rally, I accept it's traditional, but it's not all of the time and what matters to me is what the charts say, the same way when they announced QE3 everyone said, "Cover your shorts and run for the hills", but the knee jerk lasted about a day and the market went FLOP, the point, we didn't just accept conventional wisdom, but looked for the objective data.

Here's what I see so far...

 This is the spot VIX's Bollinger Band Squeeze that so far looks perfect and the last 3 days have created a nice reversal process. Considering the accumulation in VIX short term futures Friday (we bought calls and two hours later at the close they flew straight up) and considering the accumulation (that WAS NOT THERE before the F_O_M_C, thus we weren't long VXX, but we wouldn't short it either) on the 4 hour VIX futures, I'd lean toward the VIX flying (the market moves the opposite direction).

As for the SPX... Think about this logically or statistically...
 We have FIVE trading weeks in a range, that's 15 trading days and the market broke that range just enough to knock out the most probable max pain options play (the range). After 5 weeks of ranging, it doesn't seem strange that the market moved on Quad Witching when they try to cause as many retail contracts expire worthless as they can?

If that's not strange enough, consider the moves, none of which did much other than cross above the range where max pain would be for retail, but the R2K had to move +1.87% to do that, but still not far above the range, the Dow only had to move +.26% to do the same, just get above the range, that's a pretty large disparity, but the R2K has been underperforming for weeks so it had the most distance to go, the Dow had the least distance to cross the range. Both the SPX and NDX's gains where just enough to get them above the range and they didn't hold too well in to the close, WHEN ALMOST ALL CONTRACTS WOULD HAVE ALREADY BEEN CLOSED.

If that doesn't seem obviously planned out, I don't know what does and the funny thing is we saw it, we were long in to the F_O_M_C and then out that day, we weren't long the VXX until after most options would be closed on Friday and the only reason we weren't or were in VXX was the signals, not the timing, they just happened to coincide.
The SPX intraday falling off after 2 pm when most contracts are closed on options expiration and a nice rounding process. It's not the best chimney, perhaps an open higher tomorrow morning would create that, but I wouldn't panic if I saw that early in the day, I'd rather see it early than later.

As for the carry trades, FLAT, FLAT, FLAT tonight. As I said, the Yen looks like it's going to rally.
This is a 15 min leading positive in the Yen, RIGHT AFTER THE F_O_M_C, accumulation starts. To close the carry trades they have to buy the Yen, is it coincidence after what was likely a knee jerk F_O_M_C move like we always see, that the Yen was suddenly accumulated in to that move as if they were selling in to the knee jerk move and closing their carry positions at the same time, heck BAC said they are out of their USD/JPY and see a 97/98 downside target!

It just makes too much sense.

And how about the Index futures? Most of you know I won't touch a short TRADING position unless the 5 min Index future charts are negative.
 That's the 5 min ES/SPX futures chart, leading negative and you know we were entering some positions late Friday, whether long VXX or short the market in the trading portfolio, again ALL BASED ON SIGNALS OF EACH ASSET.

Even the 1 min chart doesn't look great, but I rarely trust these overnight, the 5 min chart though is a different story, it has been so accurate in predicting up and down moves as you've seen in the trading portfolio.

So the VIX futures just went positive after having been held down going in to the F_O_M_C as I commented that's what it looked like two days before the F_O_M_C and now after Quad Witching is out of the way, all of the sudden the 1, 5 and 15 min all went positive after what was almost 2 weeks of just being pinned.

There's just too much lined up and we're not even considering Credit and Leading Indicators.

The low volume volatility though and the vacations make me wonder what this is all going to look like. We couldn't collect any data right after the F_O_M_C because of the Quad Witching a day and a half later, but the last two hours of Friday after op-ex is effectively done, the signals start flying.

I'm fine with the positions entered Friday, but I WILL absolutely be collecting data and making sure we're on the right path rather than resting on what we already have which is pretty overwhelming. There's also year end performance, window dressing which if I have counted right means with the T+3 rule, Thursday is the last day for Window Dressing for year end, the "Art of looking smart".

There are a lot of cross currents, a lot of potential for very low volume and very high volatility, although I feel good about the positions Friday and the bigger picture, this week and especially after Thursday are the first time since last Wednesday that we can get real market data, I SUGGEST WATCHING THE YEN AND THE CARRY TRADES VERY CAREFULLY.

If those Yen divergences (positive) that started building right after Wednesday's F_O_M_C knee jerk are correct (and that may have been BAC that we saw as they came out late last week and said they are OUT of the carry) then that means firms are unwinding leverage and getting ready for something ugly unless I'm missing a Japanese policy component, they're going to want the Yen weak, but closing the carry will cause it to rise, that's those positive divergences and as I said, tonight, all of the carry positions are flat as a board.

The only other thing that stood out that I haven't mentioned in futures is oil looks like it's coming down (that pullback I've been looking for that has just been a lateral consolidation thus far)...

There are so many things converging right now, from the chart end of things, it doesn't look good for the market, but 5 weeks of ranging doesn't look good by itself, add everything else and it looks like an airtight case, but I'm always looking for the latest data and will continue to do so. Monday will be the first full day (Friday after 2 pm gave us 2 hours of data) we get with no F_O_M_C knee jerk and no Quad Witching Op-ex max-pain.

Friday's Dominant P/V relationship was Close Up/Volume Up which often acts as a 1-day overbought condition. From a market Breadth p.o.v., the NYSE's Advance/Decline line (even with Friday) STILL hasn't broke the October highs, that's clear trouble and not by any interpretation, by hard numbers.

Both the NASDAQ 100 and Composite's A/D lines STILL have not broken their November highs, even with Friday. The EXACT SAME can be said for the Russell 1000, 2000 and 3000 EVEN with the R2K's +1.87% Friday move (which you can't look at without looking at the Dow's +0.26% move and where they all ended up and how they closed).

When teaching Dow Theory, which can be challenging for people who have never seen it before, one way I use to give them to get a "quick and dirty" feel for whether a market, Industry group or stock is in a Primary, Intermediate, Sub-Intermediate and short term bull or bear trend was by using different length moving averages, for a Primary market, whether it was above or below the 200-day and which way the 200-day average was pointing (up or down), of all NYSE stocks, only 52% are above their 200-day moving average, at any other time in history, this would be considered and look like a clear bear market. The question now is how much did the Taper change things? Some think not much, some say it's the new "Tightening" policy tool and when the F_E_D tightens, the market drops, look at the past bear markets.

Even stocks above their 40-day (which we'd consider Intermediate trend) are at a lowly 52%.

Even worse, other than the 5 Hindenburg Omens clustered, look at the SKEW Index from recently as I have pointed out (the trend) and what it did Friday!
ACCORDING TO THE CBOE'S RESEARCH, THE HIGHER THE SKEW, THE MORE LIKELY A BLACK SWAN MARKET CRASH, THEY IDENTIFIED THE MID 140'S AS THE LEVEL WHERE THEY SEE VERY HIGH POTENTIAL FOR A MARKET CRASH.

Look at what the SKEW did last week (I pointed it out several days), Friday though, it moved from 137 to 143+!

Honestly, I have nothing to gain from being bullish or bearish on the market, I'm not on the sell side of Wall St., I want to be on the right side of the market. I've never seen so many red flags waving, but then again, we've never seen a market this extreme propped up by nothing more than a F_E_D balance sheet that is now being "tapered". The closest model I can find is the 1920's when there was a depression, then the F_E_D stepped in with several years of QE (just like the last several years since 2008), but the difference is, the 2910's recovered and were ROARING, then... You know what happened in 1929, the most epic equities crash the market has seen.

The thing is, this isn't a great model because we never recovered, the world was never in such bad shape and so tightly connected via globalism. This is one "Butterfly effect" I don't think anyone can model, but everything from globalism to HFT's have made this market more susceptible and fragile.

I'm going to leave it at that because you know what we have, for me, I need to find out what we look like moving forward and always have to stay open to all possibilities for what I do. As a trader and individual, I have a much stronger opinion that is backed by solid data.

Have a great week!