Monday, February 3, 2014

Trade Idea: SPY, QQQ, IWM Calls

I'm not sure if you are interested or not in a call position which for me, would be a quicker trade than say a long SPY (leveraged ETF) position, but if so, I think all three averages look pretty good here for a call position entry (by 3 I mean SPY, QQQ and IWM).

I'll likely be opening at least a couple very soon and will let you know before hand, I want them slightly in the money with about a MArch expiration, although I think you could get away with a shorter expiration (maybe I'll mix them up a bit).

I'll post the charts momentarily. It seems our head fake scenario is coming to pass; there's a rounding/reversal process in place with growing positive divergences so if I were looking to add some leveraged long ETFs like URTY, TWM, UPRO, QLD or TQQQ, I'd be looking to add them pretty soon, I think the call timing is probably a little more crucial and the equity/ETF positions still have time to develop a bit further.

Again, so far so good.

GLD Follow Up

Friday just before the close, once I saw the 2 p.m. -4 p.m. signals and decided on the highest probability which I was leaning toward anyway, I decided to take out a Call position in GLD, the second options position this for the week in GLD (the first being a put position for a gain of +22% closed earlier Friday). 

After having watched GLD this morning, it seemed at first it had enough in the tank to make a larger run, but then things got too lateral and when that happens there's generally distribution going on and being GLD has been trading opposite the market and I believe we'll see a head fake stop run in the market today, it all just pulled together and was time to take the GLD position off the table.

 The P/L came to just about +27% or $6800 for a 3.5 hour position, the fill was at $4


Here are the charts.
 The 1 min positive on Friday was very clear, but since the open it seems there's been distribution, slow and steady.

 Here's the 2 min chart, note the range developing as well.

The 3 min chart also negative so there was migration of this negative divergence.

It's the strength of the 5 min chart that made me think we might see some more upside, but about a percent and a half for the day isn't bad.

The 10 min chart didn't have the strength of the 5 min chart so as far as market signals go (being gold has been trading opposite the market), this also tells us our head fake scenario is looking more likely as well.

I hope you did well if you chose to take on the position.

Closing Friday's GLD March $120 Calls

UNG Update

Last week we saw some divergences in UNG which looked strong enough to bring it down, especially considering the wide-legged Doji-Star right at resistance of the large base.

We also saw a short term corrective bounce-looking divergence forming Friday. Some of you want to add to UNG shorts, for me the DGAZ long position is at full size, I try not to average down losing trades, even if it looks like they are turning in my favor. If I were to, the only question that need be answered is, "Is this the best looking possible trade to put assets toward right now?"Usually there's a better looking trade somewhere and ultimately my goal is to make the most of the assets that are put to work in the market. Don't get me wrong, I still want to see the DGAZ position do well, but unless I planned to average in to the position as part of my risk management BEFORE the trade, I think it's a bad habit to dollar cost average.

That being said, here's what we have in UNG thus far this morning.
 UNG 3 min chart looking like a distribution area at the top, to the right is the corrective -looking divergence from Friday, it already has a small negative today to the far right.

On a 1 min chart which will show more detail faster, the positive from Friday is already seeing negative divergences form to the right side.

This looks to be migrating to the 2 min chart, but 3C needs to pivot down to lock that in.

Even if this does lock in, I would require some stronger signals as this is still very early before I added to a UNG TRADING short position, but there are definitely some signs it's moving that way, just not strong enough yet in my opinion to take the risk.

Some Early Signs

When I spoke of a head fake move (last night included), I suspected it would take most of today, perhaps even longer. If you had time to read the two posts I linked, "Understanding the head fake move" for weekend reading, you'll understand this is more psychological and tactical warfare against retail traders than anything and that means the moves tend to be extreme or extreme looking because they need to look that way to swing emotions and there's no good reason to run one without accomplishing that goal. There are other goals such as accumulating at a low cost with a lot of supply and those are some of the signs we look for. We can see these signs early on, much earlier than the end of the head fake move.

So far we have some early signs, they are very young and so far still pretty small, but this is what a larger divergence builds on.

 ES intraday 1 min positive in to lower prices

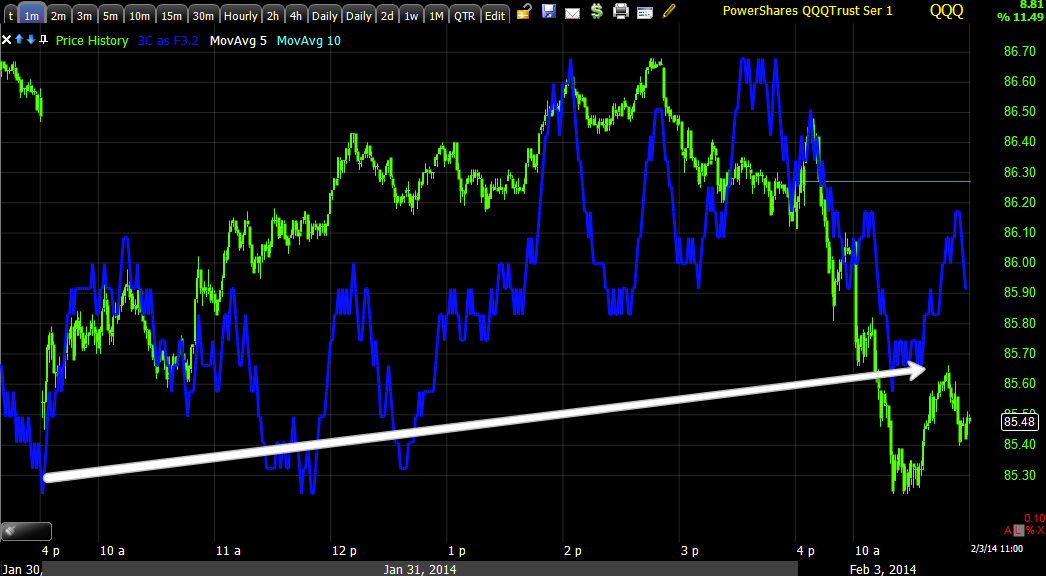
QQQ 1 min positive in to lower prices

IWM 1 min positive in to lower prices

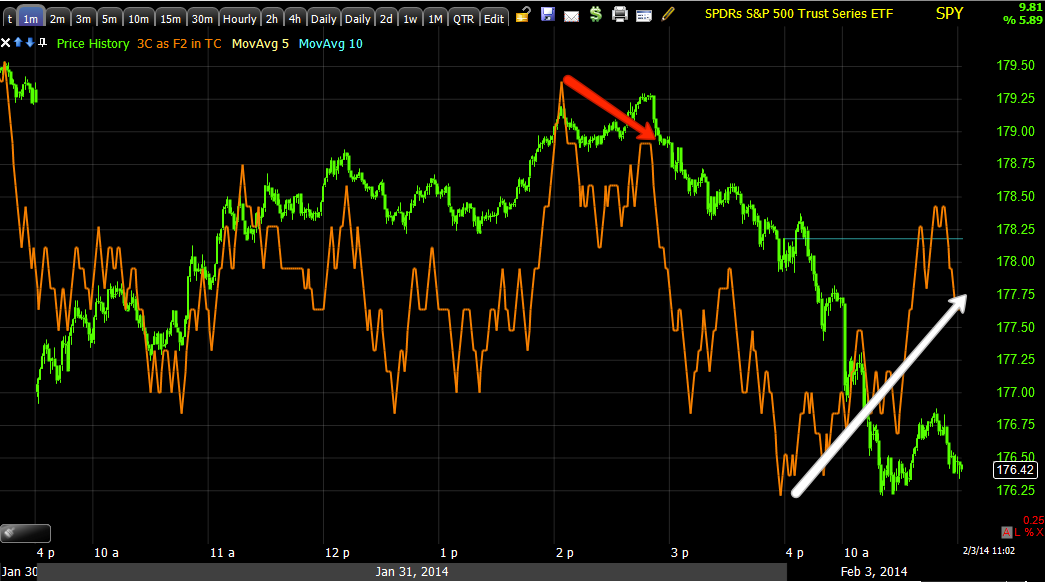
SPY 1 min positive in to lower prices

The VXX / UVXY trade opposite the market so the first relative negative divergence in to higher prices is confirmation.

Ultimately I'd say we have a lot more to go in terms of downside and scaring traders out of positions, the reversal process because very rarely do we see "V" reversals and much stronger positive divergences, but this does appear to be a start.

January Overview, Market , AAPL and GLD Update

January 2014 has been the worst month for the market since May 2012 with the SPX finishing down-3.56%, the Dow-30 a whopping -5.28%, the NASDAQ Composite -1.74% and the Russell 2000 -2.82%.

Emerging Markets finished January down (via IShares MSCI Emerging Markets ETF) -8.61% (thus all the EM central bank action recently.

While TLT (the 20+ year Bond fund which we have been watching as a potential long for the better part of a year, finished up +8.61%.

I told you that so I could show you these charts which may give us some downside head fake targets.

 SPX daily. The consolidation of last week has been around the longer term trendline, while the shorter term trend line presents a very volatile, but possible head fake target.

RSI just shows the deterioration in January.

The same more or less can be said for the Dow's short term trend line, although the long term is broken.

The Composite has been consolidating along the long term trendline, I think the short term is a bit too far of a stretch for a head fake move.

The R2K is interesting as it has been consolidating along the short term trendline.

What is interesting is last week's very heavy volatility above and below the trendline.

Here are Emerging Markets, the high recent volume appears to be a short term bottom.

And here's TLT with a double bottom, I knew there was something going on here and note the head fake move at the second bottom before the launch higher.

 Here's the AAPL P/L from the March $500 calls opened 1/30


As for AAPL, it looks pretty god with early 3C confirmation, but I just don't see high probabilities of it making much more head way with the market making its move lower, which we expected for today, we also expect it to be a head fake move, but we'll need to wait for the data proving or disproving that to develop.

So far this is the SPY making its move below last week's range for the first time with the start of a small positive divegrence, this is a good sign, but not nearly large enough yet to call it a head fake, but that's a matter of time, I wouldn't expect it this quickly.

 The Q's this morning have not made it to the bottom of the range yet.

The IWM did and so far looks ok.

GLD which I entered Friday (March 120 Calls) I will leave open, it's already at a profit, remember it trades opposite the market so when I start seeing market divergences going positive and a rounding reversal process, I'll close the GLD calls for a gain and look at new positions to open, but this all still depends on a head fake move being successful and it's way too early to tell yet.

Taking Gains on AAPL March $500 calls

Until the rest of the market can resolve a head fake move or an upside move, I don't see much more upside for AAPL calls immediately, so I'll likely return to them later.

A.M. Update

Good morning....

We are on that slippery slope, but any potential head fake move also has the same potential to fail if it is not supported, that's the thing about changing probabilities when most assets are on the right side of the top like the Carry pairs.

Overnight on a slew of bad Chinese manufacturing and Service PMI data the USD/JPY slid and broke support at $102, although Index Futures got some kind of support from what I can only guess is the PPT, we saw the same thing last week. This will be the key to everything near term. Asia didn't do well with the Chinese data out, NKD down 2%.

 This is a 5 min chart of the USD/JPY (candlesticks) vs. ES (purple line), note the break of USD/JPY under 102 this morning, but ES failed to follow it to the lower low, someone seems to be supporting Index futures.

Here's proof of it with a 1 min 3C chart of ES, positive divegrence where USD/JPY broke.

The same on the 1 min TF chart

And the NQ chart

Right now with Yen strength on the 1 min, USD/JPY downside still has the edge, the Yen 5 min chart though is still negative suggesting a move higher is still in the works for Index futures.

The $USDX 1 min went negative and then positive overnight , chopping price about, so this will be important to see how it resolves.

Right now the Yen and $USD are locked in a short term battle which may be different central bank factions throwing support out to their various interests.

$USDX 5 min still has that slight negative suggesting Index futures will break below the range, that's just the first step though and it isn't necessary, but it is probable as we see it 80% of the time before a reversal (to the upside in this case).

So we'll continue to watch the currencies dance, USD/JPY $102 is the important level, if the Index futures are eventually going to break out (with or without a head fake move) $USD/JPY $102 will have to be recaptured.


Sunday, February 2, 2014

Futures tonight opening the new week.

I think Friday's analysis still holds, the most probable behavioral move is for a head fake/ stop run below last week's volatile range, but I think that's out cue to go ahead with hitch-hiking longs (some of which we are already in) and eventually selling in to strength (price, not underlying) as well as shorting.

Here's what we have so far as futures have opened for the new week.

Cinese Services PMI have printed at the lowest on record with Australian PMI close to a 5 month low, not a great way to start the week, but this is what we expected.

Japanese JGBs are seeing a flight to safety with yields near 9 month lows.

As for the charts, pretty much what we expected on Friday for a head fake move below the range and then a move above it (the bounce).

 Typically 1 min charts don't carry much weight with me overnight, but I figured I'd show where we are with the Chinese PMI at record lows. The NQ/NASDAQ 1000 futures have a 1 min negative divergence. as do the ES (SPX ) futures.

 Also The Russell 2000 futures have the same 1 min overnight negative divergence since the opening of futures trade for the new week.

The more important 5 min charts like TF (R2K) are also negative overnight and these mean more to me.

ES 5 min are negative as well

However we use multiple timeframe analysis and the 15 min ES futures (stronger charts/signals) have a clean positive, this would suggest early weakness (the head fake/ shakeout move) followed by the bounce to the upside we have been looking for out of last week's volatile range.

 YG/Gold futures 5 min trade opposite the Index futures and have a positive divegrence this is why I closed last week's puts at a gain and opened some GLD calls Friday, I suspect they'll be short lived, but profitable.

The NKD futures (Nikkei 225) 5 min have that positive divergence that goes along with the bounce we are expecting even in Japan.

 As for single currency futures as the USD/JPY is all that really matters as far as moving the Index futures, the Yen 5 min is negative which should allow for some USD/JPY/Index futures strength.

Right now we do have some weakness in the 5 min $USDX

As well as the 15 min $USDX, I'm thinking this is enough to send the USD/JPY lower for out head fake move and allow the market to recover and launch the bounce we are looking for.

As far as how long the head fake move should or could last, I've been expecting a day / Monday, but the market always is more extreme than you'd think.

I really think it's this ES 15 min that gets the upside job done, but we'll monitor the market and make sure any downside move is in fact a head fake move by making sure there's accumulation in to it.
ES 15 min positive divegrence.

Don't forget we also have market average positive divergences in fairly strong timeframes as well suggesting a bounce and all through last week's range. These divergences are all right through the intermediate to longer timeframes and all through last week's range as we expected more than a week ago.

 SPY 15 negative before last week's range and a 15 min positive through the range as expected.

 QQQ 10 min leading positive divegrence through last week's range as well.

And the IWM 30 min leading positive through the entirety of last week's volatile range as well. So far everything has gone as we have been predicting.

I'll be looking for early gains on the GLD galls and an exit so we can double check our signals and load up whatever longs you might wish to trade for a bounce move.

I'll see you in a few hours.


Saturday, February 1, 2014

3 Bankers Dead in a Week

There's the stereo type of the 1929 crash and bankers and investors plunging to their deaths. Apparently historically there were about 120 deaths attributed to the Crash on '29, about 20 of them bankers.

It is strange though with the SPX about -4% off it's highs that we have 3 apparent banking suicides within a week, on a former F_E_D member.
What do you think, coincidence or precursor to something the Financial Industry has never seen before?


Two suspected banker suicides in London.
Gabriel Magee, a vice president in J.P. Morgan's technology department in London, fell to his death from the company's skyscraper in Canary Wharf on Tuesday. Police are treating the death as a suicide. The same day, William Broeksmit, until last year a top executive at Deutsche Bank, died at his London home, apparently also by his own hand. Though the reasons are not clear in either case, the coincident deaths will feed the discussion of excessive stress levels in the financial industry, not just for the young interns working 100-hour weeks but also for accomplished executives. Stress-related resignations, heart attacks and suicides may be par for the course in a high-octane, risky businesses, but the public does not really want finance to be one of these: Its money is at stake.

Mike Dueker, the chief economist at Russell Investments, was found dead at the side of a highway that leads to the Tacoma Narrows Bridge in Washington state, according to the Pierce County Sheriff’s Department. He was 50.

He may have jumped over a 4-foot (1.2-meter) fence before falling down a 40- to 50-foot embankment, Pierce County Detective Ed Troyer said yesterday. He said the death appeared to be a suicide.

Dueker was reported missing on Jan. 29, and a group of friends had been searching for him along with law enforcement. Troyer said Dueker was having problems at work, without elaborating.

Dueker was in good standing at Russell, said Jennifer Tice, a company spokeswoman. She declined to comment on Troyer’s statement about Dueker’s work issues.

He published dozens of research papers over the past two decades, many on monetary policy, according to the St. Louis Fed’s website, which ranks him among the top 5 percent of economists by number of works published. His most-cited work was a 1997 paper titled “Strengthening the case for the yield curve as a predictor of U.S. recessions,” published by the reserve bank while he was a researcher there.