Monday, May 12, 2014

USD/JPY Carry Cross Update / Market Update

Last week, the whole week we were watching USD/JPY and the $102 mark, I can't remember how many times it was said, "USD/JPY > $102 is the key to the market right now".

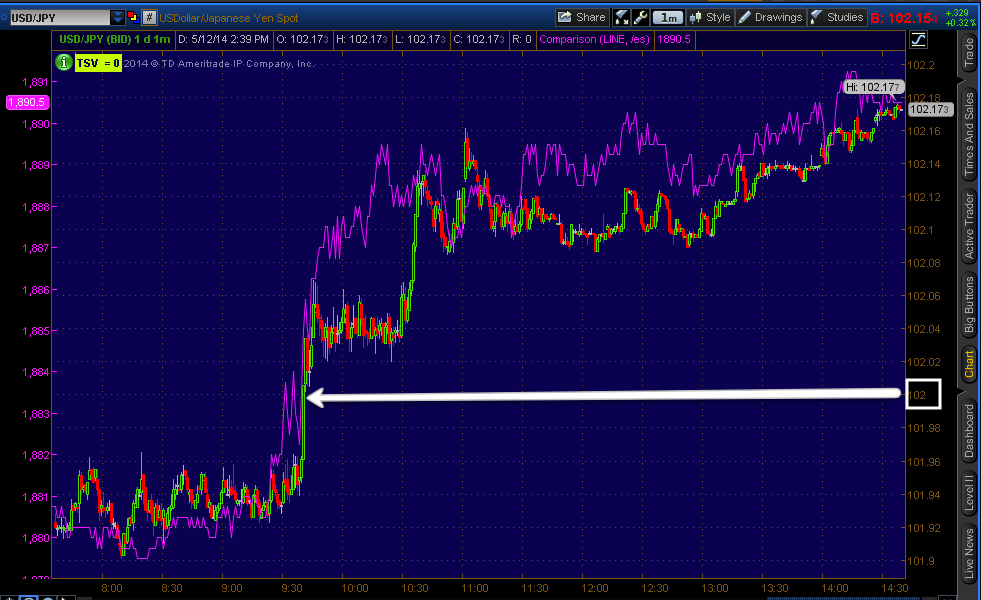
So we saw $102 blown through on the open of regular hours this morning, you can take a look at the FX charts/divergences from earlier today and compare to now if you like, they are here in USD/JPY $102 Update

I'm not posting many if any Yen charts because they are all either in line or moving positive so there is some difference between them now and this morning, but the larger, more noticeable differences are in the $USD and to an extent, the $USD/JPY pair.

As expected, the USD/JPY pair (red/green candlesticks) vs ES/SPX futures (purple) are moving together since the open as we had expected all of last week, thus the reason the psychological level of $102 was so important for us in the $USD/JPY and why we knew it would be hit as it would be pulling price toward it like a magnet, it would also be a great area to create a sham, a bull trap, whatever you want to call it, but we aren't here by accident.


The 1 min USD/JPY shows several intraday negative divergences as well as the ECB comment (I'm guessing it was around the time the European markets opened) and even though we usually don't get very good pairs signals beyond 1 min...

 We even have a 5 min USD/JPY signal which is not common and VERY rarely do we get a 15 min signal...

 However the USD/JPY looks to be largely in line at most areas until we see a move higher where we have a negative divegrence as we expected to see on a move above $102.


As for individual currency futures, as I said, there's so little change in the Yen there's no point in posting them, but they are either in line as some were and some are looking better as we could see earlier today, it appears any movement or underlying action is taking place in the $USDX below.

The 1 min $USDX intraday negative

This 5 min $USDX negative is a much bigger deal and looks a lot like many of the averages, for instance...

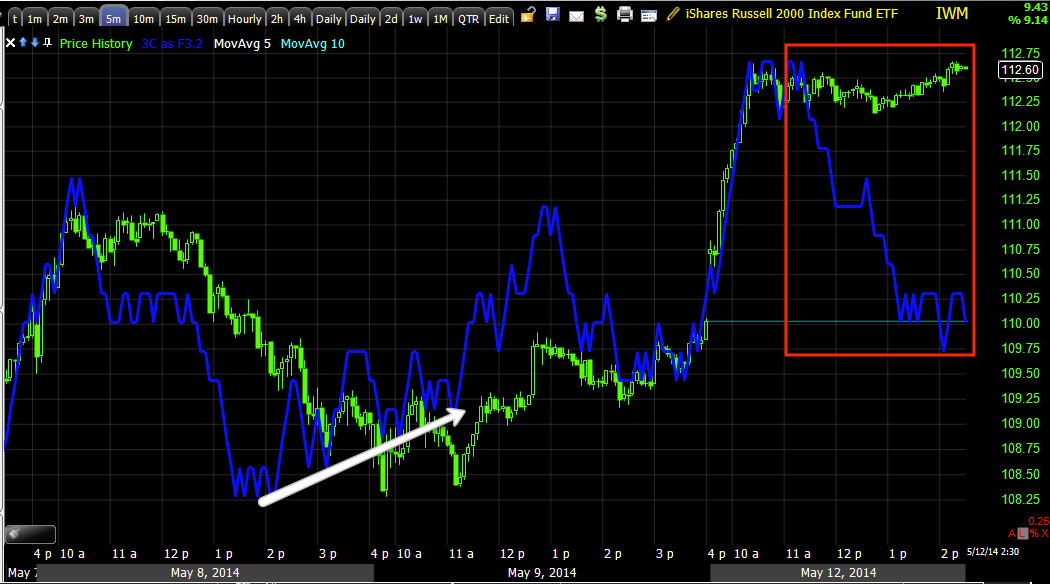
The IWM intraday on the 5 min chart and as I mentioned earlier, the DIA...

5 min DIA. I also said the DIA looked particularly bad...

This is the 5 min chart in scale to the shorter of the 3 cycles that started 4/28, remember I said there were at least 3 cycles somewhere either in stage 3 or some variation of late stage 4...

 This is the DIA 5 min chart showing the medium (longer term) middle trend -note the 5 min chart's divegrence. This was around the 11th of April to the 14th (base or stage 1) and finally...


 The February Cycle which is the long term cycle, I can't get all the way back to the 3rd of February when it was still in stage 1, but you see the different stages, "4A" is the shakeout after the initial break to stage 4, again look  at the divegrence. This is what I think is very unique for multiple timeframe analysis and on a larger scale, multiple trend analysis.

Back to the $USDX futures...
 The 15 min chart is leading negative for the new week.


As is the 30 min chart.

The strongest chart for $USDX was the 60 min, it still looks the same as the earlier post today and will be a key timeframe, but it takes a while for a divergence to move to a 60 min chart.

Closing Trading Long FXI position

I'll follow up, this just doesn't have the potential for opportunity I was hoping it would have and a gap fill is looking pretty likely, I don't see any reason to have that open risk out there without the high probabilities of reward matching or exceeding that of risk.

FXP is still a position I'm interested in, I'll post charts of these soon, but for now, I want to clean up and raise dry powder so I'm closing the FXI long trading position.

Larger Market Update

Just to give you an idea of the time we likely have (this will depend a lot on how the USD/JPY acts as it is just holding $102.09 for most of the morning), it's not necessarily a race,, the same concepts of reversal process and such should still apply.

Here are several timeframes of the IWM which also tell us a little more about what's going on with this move, the reaction to the move (how smart money is using it) and perhaps when we'll really need to be backing up the truck, but that's based on signals for individual assets so that won't all be at the same time.
 This intraday chart of the IWM , like all of the averages has deteriorated all morning, it almost looks as if there will be a gap fill,  however, this may continue as part of the larger negative we expected in this area. All of the major averages look like this and/or worse.

 IWM migration to the 2 min chart, leading negative.

 3 min...
We don't have intraday negatives on the IWM< 5 min yet, but a positive at the lows of the 9th which we saw in many different assets.

The 15 min chart here looks similar so as we see migration of divergences from the intraday charts, they should start to deteriorate these charts (5, 10 and 15 min).

 Here's IWM 30 min. of course this is not zoomed out to scale, I'm just trying to show that just because we broke over $102 as we were looking for, we don't have to react immediately.

The reversal process is still a concept that will almost certainly be a part of our set up.

This is an IWM 60 min chart, also where the highest probabilities are and the direction in which I want most of my trades unless I have VERY good reason to do otherwise.

There's a clear top in the R2K, now it's going back to USD/JPY and instead of looking for the positives that will send it higher, looking for the negative that will send it lower as well as the market averages and Index futures, with the added watchlist of our short sale assets, but again, not for a pullback like we have seen the last couple of months, for a primary trend, return to stage 4 which should mean significant new lows like the QQQ below the February lows, etc.

The USD/JPY still seems to be running the show though and the most important asset as each average looks a bit different and it's not the rotation of a healthy market (think about the DIA shown earlier today).


MCP Update

Last Friday I had posted this  MCP Update in which we talked about the continuing positive divergences and the RIMM earnings example. I had posted Friday that we needed to see MCP move more to the side, laterally.


 Here's MCP moving more to the side since Friday, actually since Thursday. The positive divegrence is a positive development, but this could be a dead cat bounce divergence.

This 5 min leading positive divergence is another story, this is the continuing positive divegrence that I want to see, something that may suggest there's more going on here than we realize which makes sense with the base, plus the expected head fake move that never materialized.

 This 10 min leading positive is more evidence of a positive continuing environment.

And here we have migration of the divergence since the earnings gap down on a 15 min chart.

This is the same kind of positive environment we saw AFTER the RIMM earnings missed that eventually led to a major corporate shake-up that sent our shares much higher to a nice profit.

Quick Market Update

This is what I was looking for to happen on a move above $102, remember, "Let the trade come to you, sell short in to price strength with underlying weakness".

This is the intraday 1 min QQQ chart, there's a negative intraday divergence, this is not reason to start selling the Q's short, but so far it is moving in to the more negative charts that were expected on a move above USD/JPY $102, which was the backbone of the set up.


So far the migration of the divergence has moved the 3 min chart to a small negative divegrence in QQQ.

There's still a reversal process, we are still looking for stronger/longer charts to go negative, but this is a great start to expectations.

 This is the 3x short QQQ ETF, SQQQ. Note that there's confirmation as the 1 min SQQQ see a positive 1 min divergence (mirror opposite of the QQQ) in to lower prices today.

And the 2 min SQQQ is seeing migration as the 2 min chart is seeing a leading positive divegrence.

This has been our expectation all of last week and now we are seeing the initial signs of that coming to fruition which is great, but it has all been based on the probabilities represented by the longer term charts, these aren't lucky guesses, they are objective data and probabilities.

GDX/NUGT Update

Here's a look at NUGT/GDX. As I said Friday, "I'm leaving room in case there's some more downside, but the signals continue to improve here and I think whether it's a day or a week, NUGT and GDX are going to fire and on primary trends, not swing so I'm going to go ahead with some exposure to the asset."

Here are the charts which are not inconsistent with the above, but there's definitive improvement as we expected when we posted our expectations for the gold miners last Monday...

 This is the NUGT/GDX 30 min chart, this is where strength has remained as part of a pullback in a larger Inverse H&S, this would be the lower right shoulder, there "could" be a second to make a symmetrical trend.

The short term weakness has been in the range and the damage that needed to be repaired (and still does to an extent) is around the range.


 This is the 1 min NUGT chart and why I sent out the post about any call positions "might" want to take gains off the table as intraday, GDX/NUGT looks to be losing some steam.

 Here's NUGT's 2 min chart, part of the reason I decided to start a long Friday.

 This is NUGT's 5 min chart, also very positive and below the range where we expected price to go and where we expected accumulation.

 You may remember it was the GDX/NUGT 10 and 15 min charts that told us as price was near the top of the range, that we'd likely see a move below the range to accumulate GDX on the cheap with plenty of supply.

The 10 min chart as you can see has started that repair with a 10 min positive, but only once we moved BELOW the range.

The 15 min chart has a little more work to do until it connects all of the lower positive timeframes with the higher positive timeframes, that's when GDX/NUGT should be done with the lower right shoulder and "could" move to stage 2 mark up. As I said before, there is the possibility of a second inverse right shoulder to make the price pattern symmetrical.

It Looks like the early NUGT strength is going to pullback

This is one of the reasons I chose a speculative position, I wasn't confident GDX/NUGT were done basing.

If you entered with Calls for a short term trade, you might consider taking gains here and re-entering later.

I'll have charts out soon, for now I'll continue to hold the NUGT long (equity).

USD/JPY $102 Update

The early (regular market) move up in USD/JPY was the long anticipated break above $102.

 There's the USD/JPY 1 min with the positive on the ECB comments and a negative in to the move ABOVE $102 finally, as we expected.

We also didn't expect this would last "too long", I can't give you an exact timetable, it's the market that will tell us, but there are already some signs of weakness building in.

 Here's the USD/JPY with ES in putrple, note the correlation has returned as USD/JPY broke ABOVE $102.

 This is the 5 min USD/JPY, it has a negative right now just like the 1 min, we can't go too much further with 3C charts when it comes to pairs, but...

 Looking at the $USDX 1 min it is in inline right now.

 However, the $USDX 5 min has already turned negative

This would hurt the USD/JPY as well as the market, this is something we expected to occur as $102 was finally broken, selling in to strength in the pair.

 More ominous is the $USDX 15 min chart which is leading negative.

The 60 min is where the $USD had its positive divegrence as you can see, now it is in line, the shorter term charts should start moving toward this longer term chart and thus far, it's looking like they will.

 The 60 min Yen had no divergence, but went negative overnight helping the USD/JPY move higher over $102.

However, the 15 min is where the Yen was negative and now it's "starting" to move positive. Again, as we expected.

 The 5 min Yen is still in line, it was negative earlier,  last week, it is now in line.

As is the 1 min chart.

So these charts in the 5-60 min are going to be very important in telling us where and when we may might want to making some stronger moves in to larger short positions.

Opening Indications

So far everything is pretty close to in line except the DIA.

The NUGT long from Friday (spec.) is also in line which is good to see thus far.

 SPY in line with the "early strength" Monday morning forecast.

The DIA is the one major average that is not in line and looking a bit weaker on the 3C intraday chart.

There's "some" weakness in TICK, but I think this is probably just natural momentum movement.

NUGT is perfectly in line, note Friday's late day divergence (positive) that caused me to open the position, I still think there could be room for a little more basing, thus the speculative, partial position.

In a few more minutes we should start getting data out to about the 5 min charts which is what I'm really interested in as far as very near term forecasting.

I'll bring that to you just as soon as I have it.

Although USD/JPY didn't lift Index futures overnight, it has caught up to them a bit since the open, there is a positive divergence around the time Notwotny would have spoken and a negative USD/JPY intraday divegrence into the opening strength. As mentioned earlier, the correlation between USD/JPY and ES has held and any movement away from the correlation in the averages has been short lived as it returns to the mean of the USD/JPY correlation.


About a 4 a.m. positive USD/JPY divergence and a negative divegrence in to the opening strength.


A.M. UPDATE

Good Morning.

Friday's post, Looking Ahead had this to say about early this week,

"There's definitely some positive activity today on intraday timeframes which leads me to believe we'll probably see some positive activity early next week...

...usually 3C divergences pick up where they left off, so my gut instinct would say early positive price action Monday.

...If we were to see some very early positive price action, because this 5 min chart isn't supportive, I doubt it would go far.

...could just allow enough space for the market or IWM to put in a more solid base as mentioned above, something like a "W".

Ad I demonstrated in this post, Perspective with the DIA, there really needs to be some overwhelmingly strong signals to take long risk against the market's backdrop."

So far this morning, the market is benefitting from overnight futures levitation which is said to be because of QE hints from the ECB's Notwotny, saying, "Interest rate cuts alone ..." not enough to combat low inflation, hinting ECB QE may be coming, but once again, either someone knew he'd say this last week (Friday) or as usual it's just being offered up as a way to understand a complicated market in a 30 second soundbite as we saw the probabilities of early strength being very high Friday afternoon from 3C signals, nothing else.


This move however, doesn't have the correlation of USD/JPY moving with it, the last two times that happened, once ES weaker, once stronger, both moves reverted back to the correlation and failed.


We also took a trading (speculative ) position in NUGT late Friday, Trade-Idea: GDX / NUGT long (speculative), that looks like it will do well this morning, I'll be watching it, I think it may be just a temporary move, but we'll let the market tell us.

More after the open...