Tuesday, May 27, 2014

Leading Indicators

Earlier I mentioned I hadn't seen leading indicators yet, but with the way everything else is looking, I couldn't imagine that they looked any better and I was right on that count.

First one of two markets is wrong or there's a fundamental shift occurring in the Treasury market correlation, Treasuries are acting like there's a massive flight to safety trade, from everything I've seen I'd agree with treasuries because when T's and equities are both up, I'd go with Treasuries, but we have so much more evidence than that alone.

It's not just the US, but German safe haven Bunds are bid as well.

Here's a look at some of the Leading Indicators telling us that our earlier analysis of this week starting off pretty ugly, is not just skin deep.

 We were talking last week about "Broken Levers" in A Few Broken Levers ; HYG which has been the go-to manipulation asset of choice among credit was showing signs of a breakdown there, it certainly seems those signs were right on target as you see HYG above today completely diverging with the SPX to the downside.

High Yield Credit is another that wants no part of moving higher and these are institutional risk assets, other larger credit markets look even worse, I'll try to get a chart of those up.

TLT, the 20+ year Treasury fund is moving up with the SPX, this is a "Flight to Safety " trade, this is not a normal correlation, it's 180 degrees opposed to normal, this is what we were seeing last week and why we closed out the TBT (TLT UltraShort) long position... Closing TBT (long) For now

As mentioned above, this is not just US Treasuries, but German Bunds that are bid as well.

 As for one of my favorite, Yields which move opposite the price of Treasuries and they tend to pull equities to them like a magnet, here you get a larger view of the dislocation (negative for the market) of Yields vs. the SPX, it's quite strong.

 And as I was saying last week, "Something changed with VIX futures", there seems to be real demand holding them together as they refuse to be pushed lower, another broken market manipulation lever. 

Look at Spot VIX today, it's actually up with the SPX and only seeing some EOD monkey Hammering to push the SPX, some small manipulation, but VIX is still green on the day, AGAIN, NOT NORMAL.

Also Professional sentiment is not willing to follow the market any further.

I'll have more shortly, but this is as bad or worse than I expected when I mentioned Leading Indicators earlier today

There's the set-up starting in NFLX

I'd set soem upside price alerts in the $400 area if you are interested in this one, I certainly am.

Earlier in the NFLX Trade Set-up an intraday move back toward $400 was expected based on the 1 min charts, it has started...
 There's the earlier divegrence on a 1 min chart that looks like it sets up some really nice short entries in to NFLX on a longer term trade, perhaps some options as well depending on where it moves to, but I don't see much reason in moving it at all if the $400 area isn't going to be hit, that's where most of my alerts are, right in and around $400, when the intraday chart goes back negative, I'll be looking at a full size position in NFLX short.

As you can see in the earlier post, there's already a lot of damage in NFLX.

FXI / FXP Trade Set-up

Friday I posted FXI / FXP update , this is a current June $36 put position, but as I said Friday,

"I still like it a lot and would consider adding here if I didn't already have the size position I want. Another way to play FXI short would be FXP which is the UltraShort (2x leveraged China 25)."

FXI short or puts or FXP long looked great Friday, we are getting a little intraday backing and filling and it looks like another opportunity.

Since Friday, FXI has lost ground and FXP (the UltraShort mentioned) has gained, but it's the longer term positioning I like here, I also think "Short China" is a decent way to diversify. FXI has significantly more volume than FXP (the Ultrashort) and I do like the 2x leverage, however I'm not crazy about the significantly lower volume.

We'll have to see how the charts develop as FXI moves lower, but for more perspective, here are some charts I didn't include in Friday's post, FXI / FXP update and today's.

 FXI intraday backing and filling 1 min

That chart is already going negative so it's giving a little better entry than earlier today, not quite as good as Friday, but still a great looking area for either an FXI short/put or FXP long.

This is the 3 min FXI chart so the backing and filling today isn't very strong at all, in fact it looks like it's just seeing heavier distribution in to that backing and filling.

This 15 min chart, leading negative FXI wasn't included Friday,

nor was this 30 min leading negative.

It's not surprising a little support was found to allow today's backing and filling considering gap support right in the area, but I doubt that holds very long.

NFLX Trade Set-up

This one is interesting because timing wise, it seems to fit just about right with the market.

First NFLX has been in trouble as far as the big picture goes, either a large top or perhaps already a break down and we've just seen the first counter trend rally....Either way, if I were long NFLX, I would be getting out.

 NFLX 4 hour chart.. You can see where NFLX's uptrend and 3C were in line or confirmation in 2012/2013, but into the end of 2013 trouble started to appear on a large scale at what may be a right shoulder of a large H&S top, then things got worse at the head area around February and in to March. As we moved to the next move up which is either a counter trend rally from the decline off the March highs or is the right shoulder of a large H&S top (Volume Analysis would confirm this as a H&S top) , in either case, 3C is making a lower high  as it should in a H&S top.

Assuming this is a large H&S top, the price pattern implied target would be a move down to approximately $150, this is a rough target based on the size of the top, they often tend to overshoot to the downside. This would also be a longer term target, not something that would happen in a month, although there could be a significant decline well worth trading from the top of the right shoulder which it appears we are forming now.

 Through some timeframes, this is the 5 min negative.

The 10 min leading negative, so it looks like we are right at the top of the last run up.

The 15 min chart also leading negative and getting a lot worse recently.

The 30 min leading negative.

The 4 hour chart alone suggests the direction of highest probability which is down.

VERY short term there's a 1 min intraday positive, pretty weak, but perhaps good for a short sale set up.

The psychological level of $400, a round number and centennial number was broken and then breached on large volume so longs chased the initial breakout and put a stop below $400 which hit a lot of stops as it moved below that this morning.

Looking at the 1 min intraday, I'd say there's a chance it runs up to about the same area which would make for a nice short entry, perhaps even a put position.

I'll be setting price alerts so I can keep tabs on this one and entry areas, the strategic short is there, the tactical is really there already, but we may be able to squeeze a little better positioning out of this one, although it's probably more than a little myopic.

Broad Market Update

I think this is a pretty good representation of what we are looking for this week. The Friday prior to last, we had a bear flag and expected some type of Crazy Ivan shakeout that gives the market enough momentum to make a break above the bear flag that formed that week, this entire scenario played out last week right down to the Crazy Ivan (SPX) on the bear flag. Since then there have been a lot of charts showing evidence of market manipulation levers failing, the last being the USD/JPY (I'll likely update those as well).

I think this SPY chart shows us where we want to be in position. The TICK chart below it shows us what is happening to market breadth on today's gap up which is a prerequisite for any number of good (bearish) candlestick reversal patterns.

The USD/JPY Carry trade charts fit right in there as well and even VIX Futures fit in neatly. Even gold's correlation fits well with the market and forward expectations/timing.

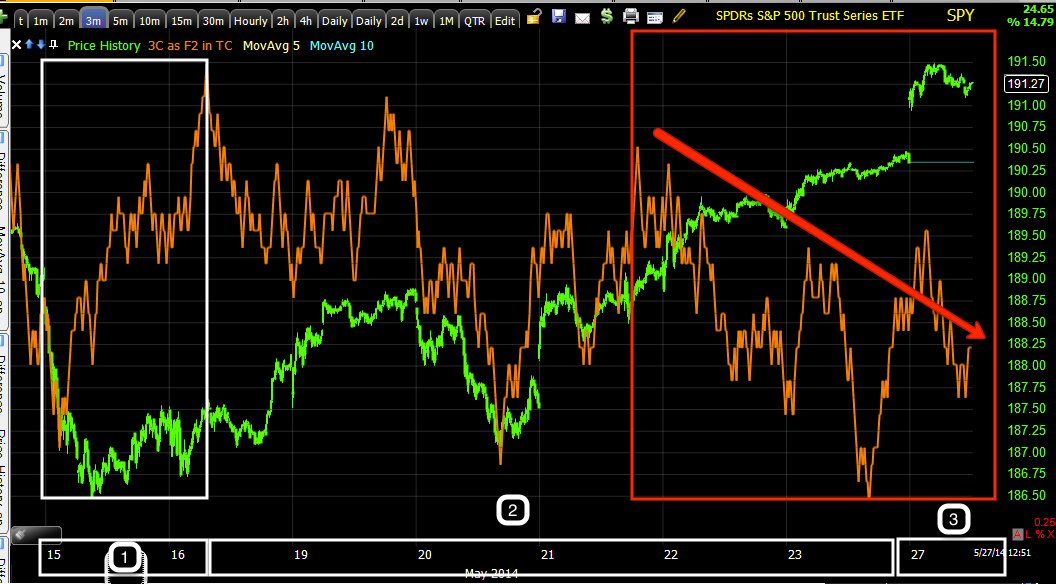
 This 3 min trend chart shows the Friday previous to last #1, that's when we had a bear flag and expected a Crazy Ivan shakeout on both sides of the flag, the one below the flag would be the momentum (short squeeze-which we saw last week in a lot of momo stocks). At #2 we have the actual Crazy Ivan in the SPX below the flag after an initial failed breakout and then the move above the flag the rest of last week. The 3C chart shows pretty clearly what was being done with higher prices.

However conceptually (our concepts), it had been mentioned numerous times that this multi-month range/top would be a VERY high probability area for a head fake move, especially because of the size of the downside reversal that the size of the range forecasts.

#3 is this week which I believe is the resolution of the entire bear flag/momentum driven move that has clearly been sold in to.

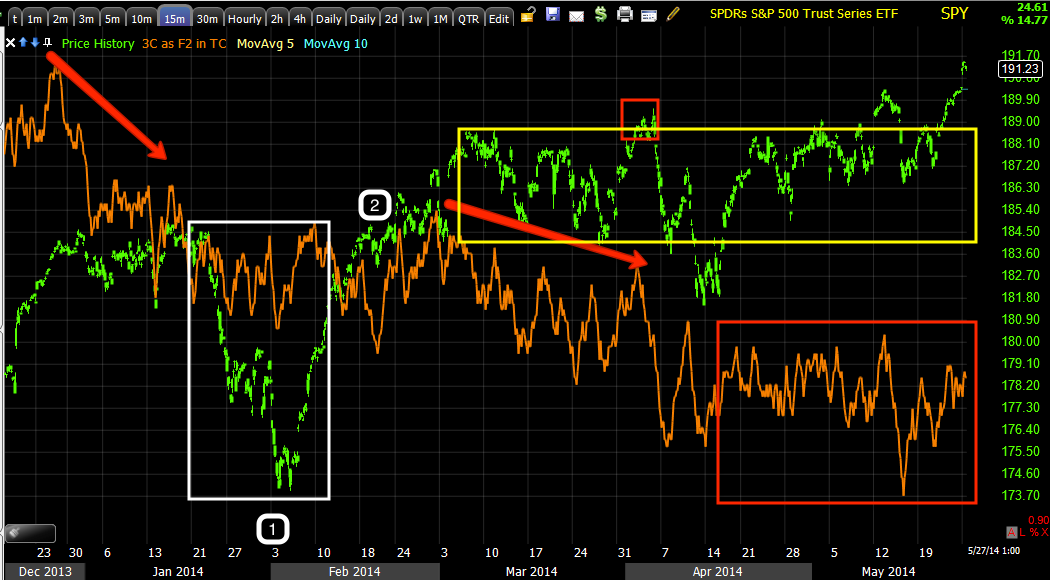
The 15 min chart's trend shows the distribution and accumulation right before and in to the February cycle and #2 is the actual stage 2 (up-trend) of that cycle. The lateral trade in yellow has been the large multi-month top/range that is a very high probability head fake move before what would be a substantial downside move just considering the size of the range alone, not to mention the continued leading negative 3C divegrence.

This is a close up view of the 15 min chart, this is where we are negative and beyond, the 1-3 min charts are negative, today is extra clear on that point in most averages, although each has a lot different relative performance, which seems to be an effect of the F_E_D weaning the market off POMO/QE as everything use to move together in lock-step.

 This is the SPY 5 min and below...

The SPY 10-min. I think as the 3 min chart continues to deteriorate, the 5 and 10 will see migration and that's essentially the key to timing.

 3 min chart with the bear flag which would not have shown a positive divegrence if it were a true bear flag rather than a set up for a Crazy Ivan/head fake.

This is what the SPY looks like today (to the right in red) compared to the NYSE TICK, more stocks are moving down than up and that trend continues to accelerate.

It's also clear on my custom TICK/SPY indicator.

As for the other averages, they are seeing the same intraday action on today's gap...
 DIA from the Crazy Ivan move down and what the market has done with higher prices based on the momentum from that Crazy Ivan in DIA

Note today's action especially.

This is migration of today's action in DIA.

 The IWM saw a very ugly earlier divergence, there's an intraday positive, I'm not sure what that is moving toward yet, but it's still intraday only.

And IWM wider negative divergence migration of today's action.

 QQQ intraday in to a flat range oin the gap up and a leading negative divegrence.


And migration.

As far as the VIX Futures...
 They are being accumulated, smart money seems to be getting a bit nervous, we saw this last week in VXX/UVXY, the timing is about right as well.

The new contract is positive out to 60 mins.
VIX futures 60 min positive already.

And spot VIX, as I said last week, it's simply not going down as demand is real.
This is spot VIX (green) vs SPY (red ) today, spot VIX is up +2.46% and up with the market gapping up, that's not the normal correlation at all.

As for the USD/JPY, as mentioned, the Yen is positive from 15-60 min
 Yen 15 min positive, 30 min is positive too...

 As is the 60 min.

$USD was negative from about 5 min to 60 min, none of this bodes well for USD/JPY, therefore it does not bode well for Index futures or the overall market.

Since earlier, now even the 1 min $USDX has gone negative.

And negative in a big way all the way out to the 60 min chart.

I think the timing key is simply the migration of SPY 5 and 10 min charts going negative and that links the intraday which are in very bad shape on today's gap up, with the longer term starting at 15 min.

The USD/JPY and VIX are confirming. I'll have to see what Leading Indicators show, but I don't expect anything different as this seems to be the resolution of the bear flag momentum move, which is pretty weak for the market in the first place that a sling shot short squeeze based on a bear flag had to be used as every other lever has broken down except USD/JPY and you can see that is quickly falling apart.

Quick Market Upate

I'm just rebooting one of the charting platforms so screen captures are more timely, but I'll have charts up soon.

All of the averages have negative intraday divergences in them, not just small steering ones either, they look pretty large for intraday.

All of the Index futures also have intraday negative divergences in them, this would be consistent with the kind of second candle (reversal) day that we were talking about Friday as they require a gap up and a weak finish on the day.

Also the USD/JPY which has been driving since futures opened Sunday night has a negative divegrence. The Yen 1-5 min charts are in line, but the 15, 30 and 60 have very large positive divergences which suggest the path of highest probabilities for near term resolution of the 1-5 min charts will also be positive which is a negative for the carry trade pair and Index Futures.

The $USD's 1-5 min charts have negative divergences, the 15 min is about in line, but confirming the Yen, the 30 and 60 min are very negative in the $USDX, which also suggests that shorter term action resolve to the downside in USD/JPY and the Index futures have been following the carry pair, thus it's not good news for the market.

As I said, I'll have charts up in a moment as the program is rebooting now.

Going through the watchlists with a fine tooth comb here as well.

GDX / NUGT Position Update

Las Friday I posted GDX / NUGT Update in which we looked at some different aspects of GDX/NUGT/gold miners including a larger cup and handle base, the head fake moves above and what I'm confident is another below a range, where positive divergences have been piling up in both GDX and NUGT.

In Friday's post, since the reversal process was getting to a pretty mature point, I had said the following...

"Usually there would be some sort of head fake move on a reversal pattern like this just before the actual reversal, if for nothing else, the bear trap it creates causes stronger upside momentum when the breakout comes."

I posted this chart with the following commentary...
"This is a closer view of the 15 min chart, it has a bit of work to do, but I'd say it's in line with the amount of time left in the base/reversal formation which I'd say is at least halfway completed. A head fake move in this rounding base pattern would be an ideal area to add or start a new long position as well as to look at call options. I'll set price alerts for a move below support of this rounding pattern."

It just so happens, the very next day (today), gold futures saw a monkey hammering pre-market and gold/gold miners have a pretty tight correlation...

GLD/GDX Correlation
 Here's GLD in green and GDX in red, as you can see they move together in a fairly tight correlation. Note the move would have taken out support for both GLD (which we will look at as well)  and GDX creating the volume that head fake moves are meant to create, so...

 This yesterday a negative 1 min divegrence was put in for Gold futures as seen to the left and this morning we saw the results of that negative divegrence sending gold futures lower, thus GDX/NUGT, the next trading day after I had said,

"Usually there would be some sort of head fake move on a reversal pattern like this just before the actual reversal, if for nothing else, the bear trap it creates causes stronger upside momentum when the breakout comes."


The 30 min gold futures chart has a strong, large positive divegrence in a noticeable range as well, so they'd be very high probability for a head fake move too.

So far, as you can see above on the 1 min Gold futures chart, it does look like a head fake move as there's no downside confirmation, but rather a positive intraday divergence in to the move lower.

As for GLD and GDX...
 So far the intraday 1 min GLD chart seems to be calling a head fake move as well as there's a positive divegrence on the move down which created quite a bit of volume as it took out stops through multiple levels.

 This is the trend view of GLD 1 min (same chart as above, the same positive divegrence in an obvious range as gold futures also above.

And the GLD 15 min chart, this probably wouldn't have enough time to confirm a downside move so I'll check in on it later, although I don't expect to see one.

As for the larger cup and handle base I had talked about last week and specifically in Friday's post linked at the top, here it is. Note the descending triangle, this is a price pattern technical traders will short as they expect a break to the downside, thus as a head fake move, it would be very effective in creating momentum from a short squeeze/bear trap.

As for NUGT/GDX, this is the range with a false upside breakout that created downside momentum and a rounding reversal process, the one I said on Friday would likely see some kind of head fake move before an upside reversal. I fully expect to see volume shoot up considerably today, it already has for this time of day.

THIS IS THE MOVE I WAS TALKING ABOUT ON FRIDAY IN WHICH I SAID I WOULD WANT TO USE AS AN ENTRY OR IN MY CASE, TO ADD THE REST OF THE NUGT POSITION IN TO...

 "A head fake move in this rounding base pattern would be an ideal area to add or start a new long position as well as to look at call options. I'll set price alerts for a move below support of this rounding pattern."

This is how GDX has reacted so far.

We always want to confirm a head fake move, even if the probabilities are very high that we have one. Correctly timing a move like this is an excellent entry point for call option positions as well.

Look for further updates today...

A.M. Update

Good Morning,

I hope everyone had a happy, safe weekend/Memorial day weekend.

The USD/JPY ramped a bit Sunday night as Futures opened and took Index futures with it, but it's already starting to show a negative divegrence early in to the North American week.
 Intraday USD/JPY negative divegrence.

As far as the 3-day candlestick pattern (bearish) mentioned as a decent probability last Friday...A Few Broken Levers...
Example chart of a 3-day reversal (bearish) candlestick pattern...

For any of the decent patterns like a Shooting Star, an Evening Star, etc, they all REQUIRE a gap up open on the second day, that's why I said Tuesday would be the very earliest we'd see a second day in the candlestick pattern formation, we'll see what the charts look like today, if it is the second day candlestick, it will be obvious well before the close.

ES 5 min...
As far as Index futures like this 5 min ES/SPX futures chart, ES anyway, is negative from 5 mins through 60 mins, every time frame. NQ has a 5 min chart that's in line, but every other chart out to 60 mis is negative with the 60 min chart being the most important as it is where the highest probabilities for shorter term chart resolution lay, that's bearish.

TF or Russell 2000 Futures are negative like ES from 5 min through 60 min, so it's nearly a triple full house.

I'm going to be looking very closely at assets today/trades. Ultimately the watchlist is one of the best indicators of the market and timing.

Lets get to it.