Friday, June 13, 2014

Opening Indications / Short Term Opinion

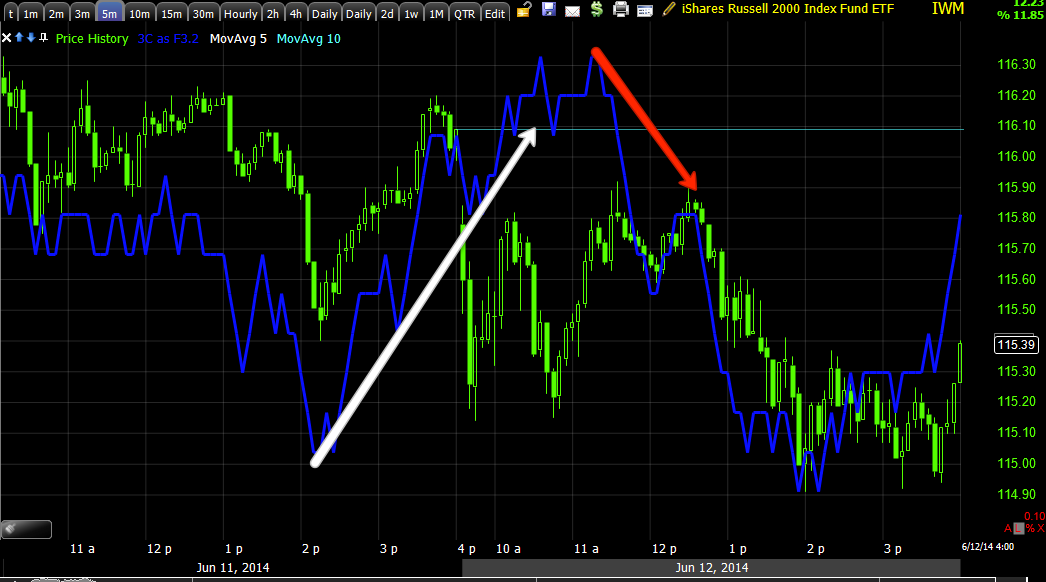
Yesterday we saw several smaller positive intraday divergences get run over and 1 decent 5 min (IWM) positive get run-over, this tends to happen when there's more fear in the air and these smaller set-ups that are in their infancy are abandoned. This is a bearish change in character I've seen in 3C before.

From what I see as of the last two hours of yesterday, the market looks to be trying to set up a bounce again, I don't mean a big one, in fact I have a target in mind, if it can set up without being run over (which an op-ex pin might help), then we can decide if it's worth trading with some leverage, like calls or maybe a 3x leveraged ETF. This is a VERY short term view. I find it ironic that there are so many H&S tops at the top of their right shoulder and turning down just a little over 3-days away from the F_O_M_C in which its board members have come out in speeches declaring their concern about market "Frothiness", a lack of respect for risk and the sentiment that the market will just keep going up forever. Don't think Wall St. doesn't know what the F_E_D is up to or planning (which makes the distribution since 5/23 rather ominous). I've shown you the Home Builders being accumulated for a year and a half as the Tech bubble exploded, WHO WOULD HAVE EVER IMAGINED THAT AFTER THE TECH REVOLUTION, THE NEXT BULL MARKET WOULD BE SUSTAINED BY SOMETHING AS BORING AS HOUSING?

And don't forget the F_E_D "accidentally" emailing 154 Wall Street Hedge Funds and Private Equity firms the minutes from one of their meetings a day and a half in advance, not one of the companies brought this to anyone's attention as they were trading essentially inside information. Since when does the F_E_D have a mailing list when their data releases are supposed to be simultaneous so everyone receives the same information at the same time? Why would they send these firms that information in the first place even if it wasn't a day and a half ahead of the scheduled release? Point being, the F_E_D doesn't want another Lehman and a lot of firms like GS and JPM have helped them out in past crisis', I wouldn't be surprised at all if they (Wall St.) knew exactly what the F_O_M_C intends on doing next Wednesday, again making the distribution since the move above the range and at the top of right shoulders, OMINOUS.

In my experience, a bull market last about 5 years (consider the one ending in 2007, the 1995-2000 NASDAQ Tech bull and now we are at about 5 years (2009-2014), some would call it the "business cycle", but its entirely F_E_D controlled except when things go really wrong like 2007/2008.

The point of saying that was to say this, the vey short term "possibility" or view I have, wouldn't violate the right shoulder and wouldn't last beyond (if even to) next week's F_O_M_C.
 It looked to me at the time of capture that this 1 min chart of the SPY with a positive from yesterday was going to pullback and that's what would be needed (as I said in last night's Daily Wrap) to create a larger divergence capable of making a bounce move, since we have seen a decent portion of that pullback this morning thus far.

 The 2 min chart where there's some migration, but we'd need a bit more than this...

The 3 min chart would likely need to be positive as well which it's not. From the price-pattern, the implied target for the SPY would be about a point, around $195.25.

 On a 5 min chart which is very far from a positive divegrence, you can see that 1 point move would be insignificant, in fact it would be normal, that's how a pattern of lower highs/lower lows is created.

As for the right shoulder of the H&S top, look at the IWM...
$116.50 would be roughly the equivalent move in the IWM, it doesn't mess with the right shoulder at all, in fact it fills it out as I had imagined earlier in the week in this post, Opening Indications from Wednesday morning.

If I'm anywhere near correct, this would also give us a rough timeline to fill out some more positions and give us an idea of when some like AAPL/PCLN would be ready for an entry.

Another Interesting Chart

Considering how many stocks on the watchlist are forming the top of right shoulders in a H&S top like PCLN or NFLX, the confirmation in the broad market (and the R2K is one of the broadest measures, that's why Bernanke use to always reference it rather than the more household Dow or S&P) is not only interesting, it's exactly what you want to see being the market of stocks will follow the stock market with the broad market having about 2/3rd s of the directional influence which is a fact that comes right from the S_E_C's website.

 A H&S needs a prior uptrend and often they are proportional, the IWM is right at the top of a right shoulder like so many other assets we have seen over the last 2 weeks. Volume is huge here considering the IWM really hasn't gone anywhere and is in a stage 3 lateral trend/top.


 Of course the 3C daily chart doesn't hurt to confirm what underlying institutional trade has been during this time...

And my award winning (it was an expensive bottle of champagne) Trend Channel held the uptrend for over a year without a single stop out until the red arrow at the H&S...

Interesting MCP Chart

I would reiterate MCP, but I think I have several times now.

Take a look at this squeeze in volatility, it's typical of a highly directional move on the way and we know that the 3C charts haven't only held up since the post earnings decline (like the RIMM trade), they have improved....

The "Volume at price" indicator isn't so important, that's not the point and those are Heiken Ashi candlesticks, you might be seeing more of them, if I decide to start using them I'll give you a primer and link it to the site.

MCP looks VERY close to a breakout.

Thursday, June 12, 2014

Daily Wrap

Tomorrow's Friday so in addition to the usual op-ex pin in place until about 2 p.m., we also get some of the best 3C data for the following week, like last Friday's The Week Ahead,

Looking at the 3C charts in to the close in both the averages and futures, my feeling is the head fake move above $1900 which was resistance of the 3 month range and the area we expected a head fake move which in my opinion is more than large enough to do what they are intended to do, will start being resolved to the downside next week, it looks from the 3C charts going in to the close that this will likely start early next week"

Transports are down -2.8% since Friday's close and saw the worst day in 4 months today, down -1.93%
IYT/Transports which put in a Doji Star reversal on 6/9 at the top (yellow box), the same day I posted, Transports / IYT Are Looking Horrible and Transports / IYT (both on 6/9), which said,

"the daily candle for IYT is looking like a bearish Shooting Star thus far, volume is already above Friday's which is something that tends to increase the likelihood of a reversal candle being effective...I think IYT is in a very interesting spot to consider it. If you are a bit more cautious, maybe see if there's a bearish confirmation candle tomorrow, I think there's plenty of downside and this would be an excellent entry area even if you have to wait on a confirmation candle of today's possible/likely bearish reversal candle."

6/9 was the absolute top, but if you are still interested, I think we'll get a second chance after today's high volume candle.

As for the SPX, since the head fake move started, measuring from the close of Friday to the next Friday, the first week above the 3-month range and 1900 (both psychological buy levels for retail/dumb money) saw a gain of 1.21% and the next week, as mentioned regarding the increased ROC of price, was up 1,34%, so far this week we have a significant change of character and they lead to changes in trends with a loss of -.99%, we just needed the reversal process as the distribution/head fake move was there.
Accumulation at the February lows for the February rally, which turned in to a 3 month range, the move above the range and SPX 1900 saw severe distribution, confirming our head fake. Last Friday's 3C information gave us a high probability of this move being resolved to the down side and we have the F_O_M_C next Wednesday, I have a feeling they'll pull out a hawkish surprise the market won't like.

As for the market, the earlier bounce attempt was run over, but I think we do get one, if not early tomorrow, perhaps toward the afternoon, we'll see if it's worth trading, here are some of the closing 3C charts for the major averages.
 SPY 1 min positive intraday divergence.

The 2 min is what was missing, toward the close it started going positive, I don't think this is enough for any move worth even day trading, but it may give us something to work with tomorrow.

However, while those small divergences were put together near the end of the day, look at the additional amount of distribution today, we are now leading negative at a new low, 3C is forecasting a major price decline, there are a few assets that need a few days to look like fantastic entries, I'll show you one at the bottom.

The Q's confirmed price action intraday.

The 3 min chart put in a positive the last 2 hours of the day, but still in the intraday timeframes and still needing some work, we had stronger divergences than this run over today.

The QQQ 5 min suggests a bounce which works perfectly for the trade I have in mind.

 However, on an institutional timeframe of 10 mins, this is how much distribution was added today alone (from the red trendline).

 And the QQQ 60 min since the February rally, this is the worst distribution we have seen and almost all of it at the head fake area.

IWM 1 min has a minor positive, but a 5 min positive was run over here today, that's indicative of panic-like selling.


IWM 2 min showed price trend/3C confirmation on the downside, so it was a solid negative day.

And the 5 min positive that was run over.

Meanwhile the long term 60 min is in leading negative position.

Another issue for a bounce tomorrow is the Dominant Price/Volume Relationship which was more than half of the component stocks of all the major averages, it was Price Down/ Volume Down, which is the dominant theme during a bear market, but has no next day short term implications, had it been Price Down/Volume Up, like Transports, the next day almost always closes higher.

Leading Indicators indicate a bounce is likely, this is probably why GLD, GDX and NUGT which tend to have inverse relationships, looked close to a pullback, although I decided to wait until tomorrow on the NUGT long before deciding, which fits with the broad market.

 HYG, High Yield Corporate Credit (a market manipulation lever) is leading the SPX a bit so a bounce to that area would not be surprising over the next day or so, however...

HYG's obvious distribution isn't going to allow it to support or manipulate the market for long, you see what happened on the last leading negative divegrence to the left, we have a worse one right now,

The VIX is leading the SPX's correlation (SPX price is inverted/green so you can see the correlation), this is a trend that was clear last week with VIX futures accumulation, now all the way out to the 60 min charts.

One of our sentiment indicators is forecasting a short term bounce, the other...

is in line with price /SPX.

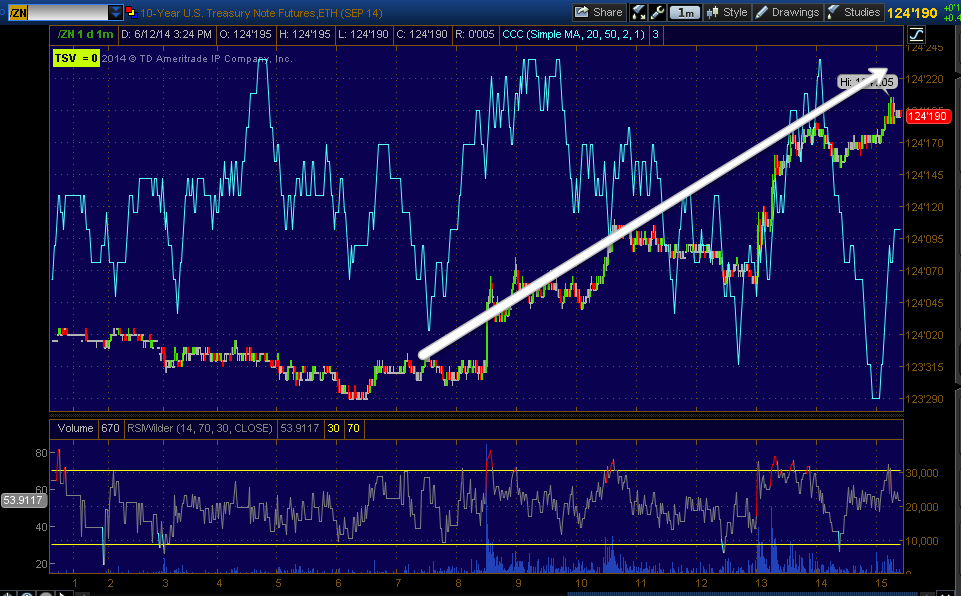
As shown in this morning's , Futures Update  the probabilities on the 3C charts were for the 5, 10 and 30 year Treasury futures to rally, as you can see, the 5 year did as yields dropped and the SPX followed along as is the correlation.

Also as you saw later in the day, our TBT short (2x TLT long) trade, TLT Long / TBT Short Position Update, also rallied and the trade is in excellent position, if we get a little pullback I'll look for the entry on the intraday 3C charts.

Commods were up on Oil (Iraq), Gold and Silver, I have a feeling GLD will pull back, thus the add to on the GLD puts today, Closing 1 GLD Put, adding to another.

As far as the trade that fits with a bounce in the QQQ, AAPL is one I've been watching for a little while, it hasn't been quite ready,, but I think this is going to be our favorite kind of trade, the one that comes to us...
 This is what I was waiting for, the 60 min chart to lead negative, it finally migrated out from the 15 min chart.

 Here's the 30 min leading negative

And that strong 15 min chart I've been watching, while waiting to see if the distribution reached the 30/60 min levels.

Intraday the 5 min confirmed, but short term, much like the averages...

The 2 min below and  1 min above are both starting to lead for an intraday move, we just need to get the bounce and look for intraday distribution since the strategic institutional charts are already there, this should make a beautiful set up.

AAPL 2 min positive starting to form, we may even have a decent call trade.

If anything pops up overnight I'll let you know, but so far so good, we just need to keep filling out those positions as they become available, PCLN, AAPL, IYT, really I have a good 400+ on the watchlist with sell/short signals.


GDX/NUGT Position Update

This one has been tearing at me all afternoon, I feel pretty confident that there's going to be some kind of pullback, but is it worth possibly missing the bigger picture that we have been involved in and tracking/trading for months? Maybe tomorrow there will be some further information that will cause me to take some action here, but for now I have to stick with the probabilities which are strongly bullish.

 1 min negative NUGT

2 min negative GDX

3 min negative NUGT

5 min negative NUGT. If the 5 min chart were a deeper divergence, I'd probably take action for a pullback trade with full intentions of re-entering NUGT long.

However, with a leading positive 30 min chart like this (and there are a lot stronger/longer charts), it's very hard to go for a pullback trade and possibly miss the big picture.

On a daily chart, there's no reversal candle at all, just solid bullish candles with higher volume every day, that's what a strong move is suppose to look like. As I said, we'll see what tomorrow brings, but for now, I can't see leaving this position.

TLT Long / TBT Short Position Update

First off, I'm looking at a lot of charts and seeing a lot of confirmation, in VIX or its derivatives, Safe haven Treasuries, in the averages themselves, there has been some serious damage done on the way up and it's being felt now and this is just the start.

Remember we do have options expiration tomorrow so look for the max pain pin, typically somewhere near Thursday's (today's) close, at least until about 2 p.m.

In any case, we entered a TLT long, but used its inverse ETF, TBT (2x short 20+ year treasuries) to get some leverage on the TLT long as the leveraged long 20+ year ETFs have very poor volume.

It was just this morning I posted the 30 min charts of the 5 , 10 and 30 year Treasury futures, Futures Update,  and their positive divergences, it didn't take long for them to make some solid gains today.

 30 year gains since about 8 a.m. this morning...

10 year Treasury futures gains since this morning.

 And the 5 year gains since this morning.

As far as the TLT long which we used TBT short to get the leverage with decent volume, Treasuries / TLT Trade and TBT Reiteration (short) / TLT (long) , the idea was this...
 TLT had fallen out of its channel, a Channel Buster, typically these make sharp moves to the top of the channel and above before falling, so it's that move up we are looking to play and we'll see what TLT looks like at that point.

Today was the first serious move in that direction after about a week of small stars and dojis forming a reversal process.

As for TLT intraday, it has been leading positive making it an interesting trade, but it needed some leverage to make it worthwhile, thus the TBT short.

 The 5 min chart leading positive and today is the first day responding to 3C's forecast of higher prices.

And a leading 15 min chart so this should be a decent swing+ move.

As for TBT, the actual asset we are short, here's the short term 2 min going leading negative and price responding to 3C's forecast.

And the larger 15 min leading negative, confirming TLT's leading positive.

I think we have a great looking trade here and rising yields should pressure the market lower.

If there's a slight pullback within the next day or so, as long as you can enter around the lower trendline of TLT's channel, I think you still have a decent entry.

Closing 1 GLD Put, adding to another.

I'm closing this GLD put,
19th/$120 and adding to the GLD 21st/121 Put which is at a speculative 1/4 position, I'll bring it up to half size.

Quick Update / Market /GDX & NUGT

We are getting some of those positive signals again, so I'm guessing our downside move is starting to find a toehold. As far as a bounce trade, there would have to be a ore substantial reversal process, even for an intraday move down, before I would consider it.

However, the divergences in GDX & NUGT are looking more serious now, not anything beyond a pullback, but it depends on how much you like to trade around your positions, or you might consider some kind of hedge. Finally, we just need to confirm the downside/pullback like MCP in the last post and we'll likely have that area where we can fill this one out. I have an 11% gain and am just thinking about what I want to do as the divergence is a bit more serious. I'll probably stick it out, but I thought you should know so you can decide for yourself.