Monday, September 8, 2014

$USD Causing Havoc

Earlier in this morning's, A.M. Update I had mentioned that most of the overnight action was in currencies, especially the GBP/USD on the news of a poll that most voters would vote for the upcoming (Sept. 18th) Scottish independence referendum. There has been weakness in that pair, the EUR/USD and in the Yen (The Sterling, Yen and Euro have all been weak ), this has sent the USD/JPY up and the $USD/JPY up.

Looking at this chart,
you might think this is some sort of divergence indicator,  this is the dislocation of ES / SPX Futures (purple) from the USD/JPY which it has tracked nearly tick for tick for years as a Carry Trade.

*Note the USD/JPY just hit 5 year highs, running orders/stops at $106. 

You may recall recent musings on the site as to whether the end of US QE is going to revert the $USD back to its historical Legacy Arbitrage relationship which has been completely skewed due to the F_E_D and carry trades over the last several years, instead of running from $USD strength, they've been following it, but the last few weeks there has been some question as to whether this historical correlation between the $SD and nearly all $USD denominated assets like gold, silver, oil and even stocks was once again returning back to the historical inversion.

While a few days/weeks is hard to call a trend after years of another trend, the timing does make sense with F_E_D QE coming to an end and some of the other sovereign issues in each of the countries mentioned above.

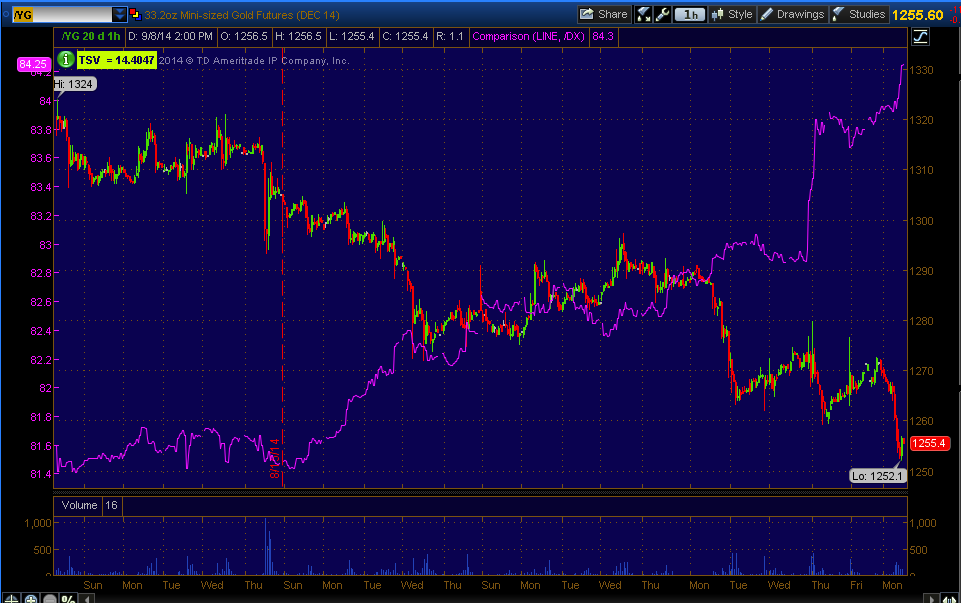
Here are some other correlations... *These charts show the $USD in purple and the comparison asset in candlesticks*
 $USDX vs ES/SPX futures on a 1 min chart, the correlation is just like the historical Legacy Arbitrage $USD correlation in which stocks, most commodities like gold, silver and oil move opposite the $USD.

This 60 min chart of $USDX (purple) is against gold futures, it does seem that there has been a recent pick up of the historical correlation. I can't find any other good 3C reason beyond the pullback we expected about 2 months ago in gold and gold miners, this does seem to suggest that the $USDX correlation is at least exacerbating the situation.

 This is the $USDX (purple) vs Brent Crude Futures intraday.

 And $USDX vs Silver futures (10 min).

Even Treasury futures are moving opposite the $USDX and down...

And the $USDX which seems to be gaining strength on a weak Sterling (GBP)...

 As well as weakness in the Euro

And the Yen...

If this historical legacy arbitrage sticks, there's another very large multi-year change in character.


IBB / BIS NASDAQ Biotech Follow Up

Here are the charts for IBB (NASDAQ Biotech Index) and the asset I prefer, BIS (long), 2x short NASDAQ Biotech Index.

 This is the 60 min IBB (NASDAQ Biotech Index) as opposed to the 2x short, BIS which I'll be comparing to save some charts. This looks like a double top , you can see the strong distribution at the first top and the accumulation between and an even stronger leading negative divegrence at the second top.

I suspected after Yellen had come out and said "There's no bubble in the equity market except biotechs and social media stocks" (paraphrased), we'd likely see a biotech rally which would enable any longs to let go of their shares in to better prices, rather than what most people assume, an all out, instantaneous panic,  this is why I wanted to wait on the second half of the BIS position.

We also have some interesting post European close weakness mentioned earlier. Although in the week ahead post from Friday my expectation was for more of the same which is largely lateral chop which is getting more volatile, that doesn't mean I expect underlying flow/signals to remain the same, especially if we are to enter stage 4 this week.

For instance, this QQQ 5 min chart is showing quite a bit of weakness not only through the trend, but today specifically.
 While the BIS position is not in direct response to the weakness in the market today, it does have a little influence on the one issue I had with bringing BIS up to full size rather than 3/4 size and wait, that was the daily chart. With today's additional weakness on top of everything else, it does have some influence on my decision, but I wouldn't be considering BIS if it wasn't standing on its own two feet.

Note the leading negative 5 min divegrence from today only thus far between the two red hash marks.

Earlier today we had a nasty NYSE intraday TICK extreme of about -1400, since then two more extremes have come in at -1650 and nearly -1700, these are the kind of extremes rarely seen, in fact last week we started seeing some crazy readings I haven't seen before near -2000. As a reminder, the TICK is the number of NYSE advancing issues less declining issues and anything < > +/- 1000 is a strong reading, at 1250 extreme.

 You saw the IBB 60 min leading negative, this is BIS, the 2x leveraged inverse ETF with a leading positive 30 min chart (60 min as well, but I'm trying to show the most timeframes and confirmation with the fewest charts).


 IBB, the NASDAQ Biotech Index's 10 min chart wwent negative and leading at the recent highs.

 While BIS's 5 min chart is leading positive in a rounding reversal area.

 Shorter term IBB's 3 min chart is leading negative as well...

As is the intraday 1 min chart, which I'm less concerned with and more concerned with the 5 min -60 min charts.

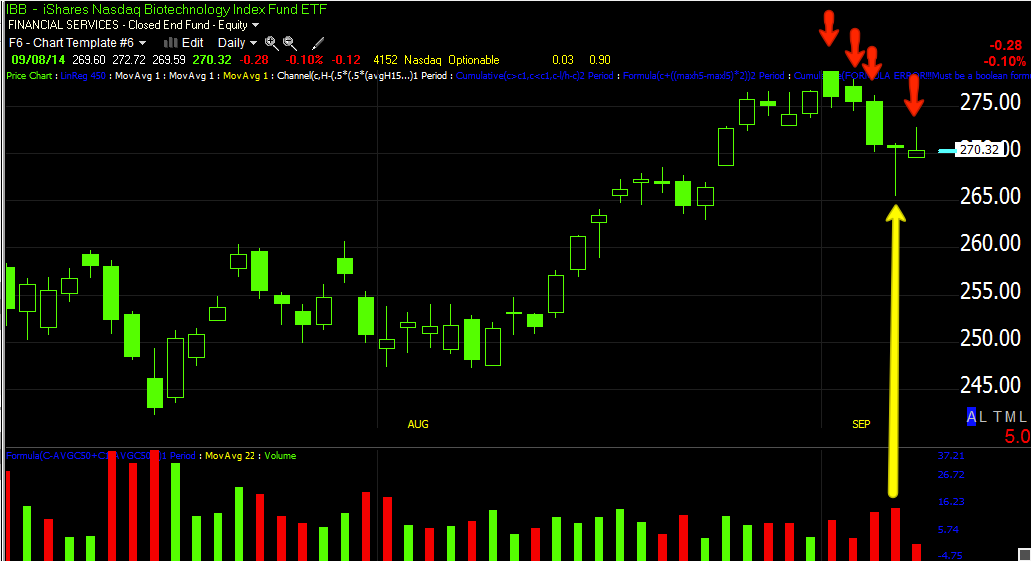
This daily IBB chart and the hammer put in on Friday on increasing volume is a bullish reversal, there's no implied target, in fact all the hammer does is say that the current trend (down) is likely to halt, but there are 3 trends, down , up and lateral, so while we usually think of a hammer as being an upside reversal (with no target, it could be a day or a month), the fact is literally it's just telling us that the trend in effect is going to change (and again we don't know for how long), which means lateral or a consolidation is a possibility as well.

Today's daily candle is not looking very good with a long upper wick and a very small body and the fact is, even if it were to bounce to a new high from here, I'd be looking at 3% drawdown which is really nothing , especially in perspective of the longer term position trade. This is where I had to take today's 3C weakness and TICK weakness in the market overall and the NASDAQ in specific, in to account.


TRADE IDEA: (LONGER TERM POSITION TRADE) BIS

I already have a 1/2 size position in BIS equity long, (NASDAQ Biotech Index 2x short), I'm going to raise that up to a full position size. If I were opening a brand new position here, I'd probably open about a 75% normal size position and leave 25%, just because of Friday's hammer candlestick, but otherwise, there are a number of charts in IBB and BIB (2x long NASDAQ Biotech Index) as well as BIS (2x Short NASDAQ Biotech Index) that are all confirming, the NASDAQ Biotech Index does NOT look good here.

I'll be posting charts in a moment, but the actual position is raising the half size core position to full size.

Market Update... European Close Strikes Again

Friday's "Week Ahead" post was one of the few in which short term direction for the market in the coming week was not obvious so I labelled  this week as "More of the same" with the caveat that I think we'll see the market in stage 4 decline before the end of the week, but until then, either more of the same chopping sideways (remember intraday lows last week took out the entire trading week's lows in all of the averages and in the Q's and IWM, took out two weeks, creating a new low (intraday) for the last 2 weeks. From the size of the reversal process and its proportionality with the 2 prior stages, it looks to be about the right size so a head fake move would likely have to come rather soon and the only near term catalyst I can think of at the moment, given the ECB was a flop, is AAPL tomorrow.

In any case,  we saw this a number of days over the last few weeks as the market has lost momentum in which the indicators turn negative in to the European close and often after the European close, it ha sort of become a recent trend, today was no different at least thus far.

 The SPY 2 min was already losing its foothold and turning negative on the open and before, however after the European close it's now moving toward new leading negative lows.

 While not a screaming divergence, the 3 min chart is not only negative at the European close, but continues after to lead to a new leading negative low out of context with price (this is not confirmation).

Intraday Q's show it pretty sharply right at the European close with a leading negative

As do the 2 and 3 min, but more interesting...

The 5 min QQQ which did not see the same small top off or positive divegrence at last week's week/multi-week intraday lows, is taking it a bit harder than the rest.

This is just this morning, but put in to context...

 The Q's are seeing their 5 min chart (which is the first or earliest timeframe we see significant institutional movement intraday) hit new leading negative lows  and it was already in a very soft patch to start this morning.

The IWM which has looked the best for underlying trade saw the same divegrence at the European close

And surprisingly it has moved all the way to a 5 min chart with a leading negative divegrence.

These alone aren't air raid sirens to quickly jump in to anything short while you still can, but they are red flags that , if they got worse, we may just need to move a bit faster than I'd like since so many of the trade set ups are moving in the right direction, SCTY just set off several triggers as I have been looking for it to make a move higher through an area of congestion.

This was not just a 3C divegrence, the NYSE intraday TICK hit a negative of nearly -1400 which is an extreme amount of selling.

And here's Es's VWAP on the day, very choppy and sloppy and VWAP continues to move laterally or slightly down.

In other words, this is essential to keep a close eye on as this can get out of hand real quick.

AAPL Reiteration

Friday I opened a speculative Call position in $AAPL weekly calls, (expiration the 19th with a strike of $96), Trade Idea (Short Term Options) AAPL Call , this was a pretty small speculative position, but I am really liking the way this looks ahead of tomorrow's product release, however I wouldn't be surprised to see a sell the news reaction later.

In any case, there's a decent chance of slightly lower prices today in which case I'd consider adding a bit more to that spec. call position, but either way I do like it for what it is, a short term leveraged speculative long position. Here are some of the charts including the bigger picture in AAPL which has been strong and has recently seen a negative change in character as well as the short term (call options) position, the signals for that and the chance for a slightly better entry today.

 I was happy to see the 60 min AAPL chart change character and move from confirmation of price to a divergence, but this 2 hour chart which has been in confirmation since the split is also changing character with a negative divegrence going in to the highs before the losses last week.

 The 60 min chart had been confirming as well since the split, it went negative earlier as it should being a faster timeframe showing slightly smaller institutional flows, but they've since grown to hit the 2 hour chart. This divergence was in advance of AAPL's "Cloud" problems, if it's actually a problem on their end that resulted in the leak of pictures of numerous celebrities hacked off their phones, some of which were long deleted thus questions about the Cloud's security.

 The 10 min chart seems to show there was some inside information being traded as the leak story was hitting AAPL's share price, however I'm interested in the most current signal in a flat price range with a positive divegrence through it, thus the reason for the call position. This is not big enough for me personally to warrant an AAPL equity long, but I suppose if you had a large enough portfolio it might make some sense.

 The 5 min chart has good confirmation in the area, note the flat trend after the decline with the positive divegrence running through it, n these flat trends are where we often see the most underlying action as it appears there's nothing going on by price alone.

As for possible better intraday entries for a long/call, the intraday 1 min chart has been spot on in calling out the decline before it happened and the positive that at least stopped the decline and changed the trend to lateral. The action today is slightly negative on the day, but not for the range, thus you may see some slightly better prices intraday on a pullback.

I'll be setting some price alerts below current prices and I may add to the AAPL call position if they are triggered and have decent looking positive divergences on those alerts.

FSLR Trade Set-Up (Management) Follow Up

This is one of several stocks featured last night as a trade set up, letting the trade come to us rather than chasing it,  it's also a trade management as FSLR was entered as a partial position, about half, as I was hoping to fill out the other half at better prices if they became available.

In the last post I covered all of the longer term charts since I haven't updated FSLR in a while as I've been waiting for it to make a move worthy of an update, here's last week's, FSLR Position Management & Trade Set-Up.

The hope was to fill out FSLR, a triangle top, above $74. Since last week's update, very little has changed other than the 5 min chart which is about the right timeframe for the kind of move I'm looking for, as far as the strategic reason I like FSLR short, the post from last week has all of that information.

Here's the updated charts and the Aug. cycle's stop or area I'd want to be short by, or at least enter no lower than this area if you prefer to wait on price confirmation.

 Last week's post discussed (and gave examples) of how these larger multi-month triangles (rather than multi-week) are most often tops or bottoms depending on the preceding trend, in this case a top. These are also very relaiable head fake movers as the price pattern is mistaken by technical traders as a consolidation/continuation price pattern (which it's way too large for), thus technical traders are easy pickings for a head fake bull trap or false break out of the triangle which is where I was hoping to fill out FSLR or if I wasn't in it, start a new position.

 On a daily chart note the large "Crazy Ivan"-like shakeout, this is when both the stops and limits are run, but in this case the stops are run and new shorts are pulled in to a bear trap, which helps give the upside reversal the momentum it needs to pull off a bull trap which FSLR is struggling with as the last 3 days' candles have shown longer upper wicks or a rejection of higher prices.

 The 5 min chart is pretty much where everything is happening so it's not a game changing timeframe other than being the right length for a false breakout and having enough juice to make such a move, however it seems FSLR will need some market or sector support,  although FSLR is up +1.05%, its sub-industry, "Specialized Semi-Conductors" is only up +.17 while the Industry, "Electronics" is up +.29% today... not much in the way of support/help.

The last resistance area/distribution can be seen as well, which is part of the previous 3-days' candles.


 Right now the 2 min chart is struggling a bit, but it hasn't given up, these shorter charts are where we'll see deterioration of the 5 min positive divergence first.

An even closer look with a 1 min chart seems to show profit taking in to today's move, again, perhaps AAPL will be of assistance tomorrow broadly in the Q's and Electronics/Semis.

The Daily Trend Channel has held the entire August cycle and has a current stop of $69, which it will continue to tighten and lock in more upside, so I'm guessing it will be above $70 by the time FSLR has completed this move which is still a fantastic entry,  however just as I said last week, I have my alerts set (which FSLR has been hitting today) above the $74 area which is ideal for a head fake move, ideal for an entry and the lowest risk.

I'd keep this on the radar and maybe set some downside price alerts as well, although I'd like to catch this as an add to > $74, I certainly don't want to miss filling it out above $70 should it not be able to pull off the move.

Opening Indications

So far there's nothing very surprising in the opening indications, a bit of more of the same from last week, although the lateral chop is widening as volatility picks up in the broad averages, again dispersed this morning with half red and half green.

There are quite a few of the watchlist "Trade-Set-ups" hitting alarms this morning (price alerts) including FSLR, SCTY, NFLX, etc.

Here's the basic concept through most of the averages using the SPY as an example.

 This 30 min SPY chart is one of the longest charts to show the early August accumulation/base which we identified July 31st as the market had a big -2% day down, not exactly the kind of day you'd normally start cleaning up your short position trades and looking at piggy back longs, but breadth had been destroyed and was way oversold, the current situation in breadth is that of a complete stall. Even though Breadth indicators recovered by 20% the first 10-days of the rally/bounce to move out of the oversold zone starting Aug 11th, since then they've lost all momentum and are for all intents and purposes either flat or in many cases have already turned down to 1 week lows.

The August cycle shows pretty clearly what it is used for as strong distribution kicks in just as soon as the former resistance is surpassed. As far as staging, I'd call this a late stage 3 in the cycle with stage 4 (decline) being next in the process.

The Custom SPY/TICK Indicator also shows this breadth process go from bad in early August to improved and then lose momentum and start to turn to the downside again, this would be very consistent with the staging, as well as the flat trend in price itself, which is part of the staging.

 Last week the SPY made a new low for the week on Friday, this is where it picked up some support as it was heading toward a collapew, some of the other averages were even worse. I suspected that this is for a head fake move which I've expected just as a matter of concept.

 Intraday today so far, there's nothing special, pretty much confirmation of early action, at least as of this capture. However...

 The additional little top off (gas in the tank) at last Friday's intraday /weekly low), seems to already be showing signs it's starting to run on fumes, when the 5 min chart is hit, it will be.

The IWM is the exact same concept except this hit 2 (trading ) week lows last Friday, the additional gas in the tank/support at those lows can be seen here and as of now, I think the IWM looks the best as far as underlying trade.

 Intraday today it is in line, although since capturing these fast moving charts, all have deteriorated since.

 IWM's 3 min chart also showed some of the weakness SPY is starting to show, but has recovered for the moment.

 Unlike the SPY and IWM, the Q's hit a 2 week trading low Friday, but did not see the same level of assistance (short term) as the chart is in a leading negative divegrence with no positive at the lows on the 5 min chart.

On a 1 min chart there was minor support for the Q's, I'd say they look the worst of underlying trade, they are in line this morning at this capture, but have since deteriorated. Maybe they figure AAPL will be the support for the Q's, maybe they are just ready to sell the AAPL release, they haven't been revolutionary for a couple of years, more evolutionary.


HYG as a manipulation/market support lever tried to put in a positive divegrence last week which failed, it's trying again here with lateral trade and a small 2 min positive divegrence, but to put that divergence in perspective as HYG is in horrible shape...

 This is the same 2 min chart's trend covering the entire August cycle, so the divegrence it's trying to build should be kept in perspective vs the trend of the cycle, in other words, even if it does, it's very short term in nature and very weak, maybe enough to pull off a head fake move, but not changing the staging of the market.

And HYG at the 5 min chart's August cycle, I wish there were more beta here as this one is heading for a lower low which will put it in a solid downtrend as it will have 2 lower highs and 2 lower lows  and it leads the market.

I suspect AAPL will hold things up until tomorrow's release.


A.M. Update

I hope you all had a great weekend.

The big news over the weekend seems to be the Scottish independence referendum on Sept. 18th which has largely been ignored while the sterling has lost quite a bit of ground over the last couple of months. Through the overnight session GBP/USD lost 200 pips at one point as a poll came in showing a majority of voters would be inclined to break away and vote for independence. It seems currencies and this story in particular are where most of the overnight action has been.

Also China and Korea were closed overnight with China re-opening tomorrow and Korea on Thursday.

Speaking of China, they reported a $49.8 bn trade surplus and Germany reported a $100 bn Euro trade surplus for July which is a record high, however the US is running a trade deficit causing a few people to wonder where all of these Chinese and German exports are going.

Japanese Q2 GDP was revised down overnight from -6.8 to -7.1.

The Hang Seng is down -20 the Nikkei up .23 and Europe in the red with FTSE -.83, the DAX -.16 and the CAC-40 -.48.

Late Friday, unlike most Fridays after the weekly/standard op-ex pin is lifted around 2 p.m., there weren't any strong short term divergences that usually guide trade for the week, especially early on and my opinion was "More of the same", at least early on in the week and an expectation that the August cycle will move to stage 4 decline some time this week. So far the market is pretty close to flat, which is, thus far, the lateral chop/top or more of the same since last week.

AAPL will unveil the IP-6 tomorrow with an informal survey conducted with 66% of the small sample saying they'd be buying the IP6, while 75% of the sample said they'd be replacing their IP5's with the IP6. Perhaps we'll see some action on those AAPL calls from Friday.

We'll see what the open looks like, I do still expect some sort of head fake move, but will be watching for any signs of strength in any of the levers like HYG or the carry trades, otherwise it may be up to AAPL or perhaps like 2007's top, there just is none.

Have a great day.