Thursday, September 18, 2014

Market Update

*I may be posting an MCP call position very soon, I've been watching for increased volume on the day, an area of stops/short orders hit and I've seen those, a closing bullish hammer would be a nice end to the day as the inside day range of 6 days makes for a clean, clear stop level for a head fake move. I have initial positive divergences growing since the intraday volume surged, I'm pretty close to pulling the trigger, but am looking for just a bit more confirmation. I'm looking at October 3rd expiration, $1.50 calls and of course as always, I'll post any position BEFORE I enter it, just a head's up.

As for the market, it's nearly frozen in a lateral trend as if waiting for something, BABA?

 Remember this week's positive divergences in the averages from Monday to Tuesday morning reached as far as the 5 min charts.

The DIA is seeing quite a move on the 2 min chart, in actuality, strip away everything other than this week's early divegrence and the cycle and this is about where I'd expect a 1.25day divegrence on a 5 min chart to run out of gas so this isn't anything really surprising.

 The 3 min DIA is seeing migration from the 2 min chart.

 And the 5 min positive from early in the week is at a relative negative divegrence as migration from the 3 min chart bleeds in to the 5 min chart's signals.

 IWM 2 min shows the positive divergence early in the week, also note the head fake move (yellow) just before the reversal, it is proportional with the cycle/trend. While this chart is largely in line with the price action or inaction today...


 The stronger 3 min chart showing some trends from before this week as well as this week's positive and head fake stop run is showing a relative negative divegrence, not extreme, but in line with expectations of how much gas was in the tank and how far we have moved and for how long.

 The 5 min chart shows a bit of a broader trend with deep leading negative divergences at the left, the positive this week and head fake/stop run in yellow and a bit of a leading negative on the day.

 QQQ 2 min accumulation early in the week, also a quick move to tag stops in yellow and a relative negative divegrence taking on leading negative characteristics.

 This is the chart I mentioned yesterday in QQQ 3 min which had a sharp negative divegrence , it has continued today.

 And the 5 min QQQ with the positive and so far an in line trend at the green arrow as 3C follows price thus far.

 The SPY 1 min is flat on the day just like price, a strange day for price, however these flat ranges that appear boring often have a lot of underlying activity, both positive and negative. This is what I refer to as "The kids being a little too quiet in the next room", you know they are up to something.

The 2 min SPY is showing deterioration, again nothing huge, but in line with the earlier positive on the week.

The 3 min, like the Q's is where we are seeing something a little out of the ordinary.

 And the 5 min looks pretty normal from a small positive to an increasing negative, in other words, distribution in to higher prices or the failure of something esxpected yesterday that didn't pan out.


 Today's NYSE TICK/Breadth is extremely flat like price with most of the action or non action in the -500 to +600 range, very quiet with a few outliers.

The same is seen on the SPY TICK custom indicator.

A very quiet day.

What does price action have in common?

HYG, in red. Price id literally pegged to HYG.

HYG Update / Alibaba

It has always been an interesting concept to be able to see underlying trade, but not know why or exactly when underlying trade will kick in, just that the probabilities are highly in favor of underlying trade signals (3C for example).

HYG has had an enormous amount of influence on the market. If you follow our posts and Friday afternoon, "Week Ahead " updates, 3C divergences and Leading Indicators have given us a pretty darn accurate call of the week ahead from late July (31st's) deeply oversold BREADTH (I really don't care about oversold indicators as they aren't very reliable) and expected base/bounce which was the August cycle to the forming of the base for the August cycle in which not only 3C positive divergences told us an upside move was coming off the base being constructed, but in other assets, especially HYG which bottomed on 8/1 and led the market higher as opposed to the SPX bottoming or ending its base on 8/8 with a start higher on 8/11. The Week Ahead updates calling for more upside, then a choppy topping range and eventually HYG moving to stage 4 were all telegraphed via either 3C and/or HYG. I've published these charts at least 2 dozen times over the course of the August cycle, but as a quick reminder of the degree of correlation, this is the SPY vs HYG (green and red respectively).

This 30 min chart of HYG (red) and SPY (green) shows the leading correlation I'm talking about above, although it does not show the early HYG divergences calling out HYG's likely shifts that create leading price divergences between HYG and the market/SPY, although they are there.

HYG has long been one of our favorite leading indicators because it's one of the most liquid ways for smart money to trade credit since the banks that use to loan credit to institutional firms rid their balance sheets of most credit after the financial crisis, making HYG one of the most diversified and liquid ways for institutional money to trade HY credit which is viewed as  "Risk on" sentiment via smart money and as such, HFT's and algos are programmed to follow the signals and buy stocks on HYG gains, sell them on HYG declines,  this is the entire basis of Capitals Context's ES Context model as well as their SPY Arbitrage model except in the first case many other assets are used including rates,/bonds, precious metals, commodities, other forms of credit derivatives, etc. while the SPY arbitrage is only 3 assets, the risk on HYG and risk off VXX and TLT.

This has made HYG one of the easiest levers for short term market manipulation, rather than the old days of buying or selling the most heavily weighted stocks in an average to get the average to move, now 1 asset alone can be manipulated and the HFT/Algo correlation programs follow it.

Above, while a little confusing, I show different stages of HYG's August cycle at the white arrows such as the bottom/positive divegrence of 8/1 while the SPX just started it's base/stage 1 accumulation on 8//1 which lasted through 8/8 with stage 2 mark up on 8/11. As you can see, by 8..2, HYG was already in the mark-up/stage 2 phase, once again its price divergences vs the market/SPX leading the broad market averages.

HYG transitioned to stage 3 top which is characterized by a lateral (sideways) trend before the SPX (I have marked the SPX's important transitions with yellow arrows).  As you can see, HYG has led the SPX on average by about a trading week, even it's move to stage 4 decline was followed shortly after by the SPX's trend of lower lows and lower highs. The bottom line is HYG has led the market by approximately a trading week.


 Here  on a 10 min chart of HYG/SPY, while the SPX was in a downtrend, arguably entering stage 4 with a series of lower highs and lower lows, so distinct that it was our minimum upside target in Friday's "Week Ahead" forecast; HYG had been in a nearly week long flat range and positive divergence which was also part of the reason the forecast for this week was looking for strength in to the F_O_M_C, Tuesday our forecast took on legs after a day and a partial morning of accumulation in the major averages out to about 5 min charts.

Obviously our minimum target was hit wand volume surged on the breakout, which is why I chose the downtrend as a technical feature that would create the desired effect of any head fake move to the upside, to get bulls to buy and for that as most everything they do is price/confirmation evidence based, a break above the downtrend was the closest area to get them to make moves and create demand that can be sold/shorted in to.

 On a 5 min chart, HYG and SPY move almost perfectly in tandem, better than any other correlation like the former leader, USD/JPY and more recent leader, AUD/JPY. HYG, by far has the tightest correlation as seen above.

On a daily basis, the SPY is struggling with the knee jerk failed highs from yesterday and HYG is of no help at all, although not declining as of yet either.

Just put these two on your chart and watch the correlation intraday.


What grabbed our attention last week and guided last Friday's "Week Ahead" forecast was the flat range in HYG with leading positive divergences which made it clear that this week we'd see market upside which I speculated was either to be used in conjunction with a F_E_D / F_O_M_C knee jerk upside rally on the grounds that the market had already discounted the bearish removal of the "Considerable time" language in the F_E_D statement and after the policy announcement, Yellen would give one of her typical dovish Q&A's walking back any bearish fall out from the language removal which had already been discounted by the market as a sure thing.  The idea being, between HYG support and this F_O_M_C knee jerk-boost, our head fake move on a large month long stage 3 reversal process which we have been expecting for weeks , would finally pop and give us the entries in short assets as well as these moves being an excellent timing indicator.

Interestingly, neither the language was removed from the policy statement yesterday although Yellen made it abundantly clear in the press conference in which she was not her normal dovish self,  that it is meaningless from the F_E_D's perspective as everything is data dependent. So why not just remove the language altogether? I suspect it was a red herring to distract from the fact that the median forecast for the F_E_D Funds rate continues to rise and did so again yesterday (the infamous "DOTS" ) for both 2015 and 2016 with yesterday being the first time the F_E_D put out 2017 guidance.

As I said above, we can see the underlying trade and divergences, but we can't know exactly why they are there. After yesterday's VERY weak knee jerk pop higher was completely erased before the close, one of the fastest F_O_M_C knee jerk fades I can recall, I started wondering about other possibilities for the HYG divergence.

Tomorrow's main event struck me as a VERY good reason for broad market support right now, THE ALIBABA IPO which may just be one of the largest, most over-hyped IPOs ever.

While the average IPO has raised about $5 billion and traded up +10% over the first week, you may recall from the FB IPO that they don't always tend to fare so well much longer. The last 5 largest US Initial Public Offerings fell on average -17% in their first year of trade according to Bloomberg. 

However Alibabe may be one of the largest IPOs in history. At the median of the expected pricing of $66 to $68, Alibaba could potentially raise $25 billion, one of the largest IPOs in history with an approximate valuation of $165 billion.

However, this is where things get interesting and may have an HYG/Market support connection. 

While typically an IPO is brought to market by 1 bank, Alibaba has five structured in the IPO deal. While the typical 6 month lock-up period which forbids insiders and deal makers from selling before the first 6 months, the top shareholders stand to make a fortune from the shares they agreed to sell in the IPO despite whether they are in the 6 month lock-up period. The 4 biggest potential beneficiaries include Soft Bank, Yahoo, Alibaba founder and executive chairman Jack Ma, and executive vice chairman Joe Tsai  who aree all under a 1 year lock-up , but will own 58% of the company's shares after the deal.

Where this really gets strange is the 6 month lock-up period as public filings have shown $8 billion in shares from insiders/early investors have NO LOCK-UP PERIOD WHTSOEVER, and none of them are identified, meaning come tomorrow, approximately $8 billion in Alibaba shares can be sold immediately for a quick cash out, which is highly unusual for an IPO with the standard 6 month lock-up before any of these people would be able to sell. This obviously includes insider as well as the IPO staging companies, 5 banks, which is unusual as well. THIS IS ABOUT 1/3RD OF ALIBABA'S  SHARES THAT AREN'T UNDR LOCK-UP, HIGHLY UNUSUAL. 

Why put in such a clause if these insiders/early investors and IPO staging banks didn't have an intention of selling on the IPO or shortly after? The best description of these people from public filings are called, "Some holders of preferred shares", that's as far a identification of the group not under the IPO lock up goes.

In any case, if you want to exit at the IPO, one thing that would be helpful in market support to get out at the best prices possible.

We know that the market works days, weeks, months and even years in advance as shown with home builder accumulation in 1999 and 2000, well before the start of the housing mark-up and eventual bubble. Point being, the HYG positive divegrence that I assumed had more to do with a head fake move being completed , may have more to do with one of the largest, most over-hypped IPOs in the market's history, which could also kill two birds with one stone as far as our initial head fake move/support goes as well.

We won't know until we know, but we do know that HYG which is in a lot of trouble on a big picture basis, was used over the last week, was accumulated for market support and just before this historic IPO.

As for HYG divegrences, we did see the first signs of weakness after yesterday's knee jeerk reaction to the F_O_M_C faded and gave back all post F_O_M_C gains.

Right now HYG looks like this...
 Intraday this is one of the first problems we have seen with HYG since the positive divegrence, right at yesterday's knee jerk highs.

There's at the end of the nearly week long HYG divegrence which just so happens to put in a head fake /stop run right at the white box, positive divegrence, before reversing to the upside, the head fake/timing concept in action. We also see some migration of the intraday negative to today's chart leading negative, but this is still small beans compared to the size of the positive divegrence over that week long period.

 This is the primary divegrence we have been following and have based near term market upside forecasts like Friday's "Week Ahead" post on. This divergence is leading positive as it has been and still in line. This divegrence will have to deteriorate before I suspect a move to the downside is on its way, however interestingly the expected F_E_D motivation hasn't done much which makes me wonder if one of the largest possible single pay-day IPOs tomorrow, may be the real reason, it's a good reason.

 Intraday the 5 min chart is showing some deterioration.

 And the 4 hour chart shows the highest probability resolution for HYg which is clearly down. Interestingly we saw a lot of deterioration in nearly every indicator as of July 1st, the first day after Q2 Window Dressing ends, we see the same here with a leading negative divegrence.

The green arrow to the left is upside confirmation of the price move.


And worst yet, the daily HYG chart which hasn't shown any exceptional signals until 2014, which should be very clear as the deepest leading negative divegrence on the strongest daily timeframe chart.

Thus I have no doubt of the resolution to HYG's current stance and the market with it, as far as whether BABA is the reason, tomorrow will offer a lot more insight.

We've also had excellent luck with IPOs, some of you may recall the FB IPO which was a nightmare and it quickly became the most hated stock, we were the first to enter a long position on the FB decline which paid off big time while it was still the most hated stock so I'm looking forward to BABA, but more so to unravelling the short term signals and whether Alibaba is the real reason market support was needed as $8 billion is distribution on an IPO would need some significant market support to make it profitable,  but why else put in such a clause allowing nearly a third of the shares usually under a 6 month lock up to be excluded right from the get go tomorrow?

Perhaps large IPO performance as cited by Bloomberg above might be a good reason given the market's condition?


Gold Futures & DUST P/L

I went ahead and closed the DUST position, not because I think that it's unlikely that DUST can make some further gains, but because I think it's likely that the build of the gains or easy money is now over and anything from here is more or less a lot of energy \watching for a very minimal return based on early observations.

I am not advocating a long GDX/NUGT position or add to at this point, although on a primary trend basis (long term), this is one of my favorite candidates for a long term long position. However like any asset, a "V" reversal is rarely in the cards and there's a reversal process that needs to take shape which should give us further confirmation of the strength of the position, probabilities, timing and best entry/lowest risk.


The DUST P/L worked out as follows...


At a cost basis of $15.90 and a fill of $22.18, the final P/L came out to +39.5%

Looking at Gold Futures...

 This is a 60 min longer term chart of gold futures (/YG) with a recent and impressive leading positive divegrence.

 The 30 min chart has the same leading positive divegrence and if you look at the daily price action in both GLD and GDX, you'll see what looks like an upside down "Igloo with a Chimney" so we may be a little further in to a reversal process than initial thought, but I still want to see strong 3C confirmation as there are at least 6 or more assets we can use to confirm GDX signals.

 Near term, this would be the "Chimney" portion of the chart , although upside down and the recent change in intraday character seen on GLD and GDX charts.

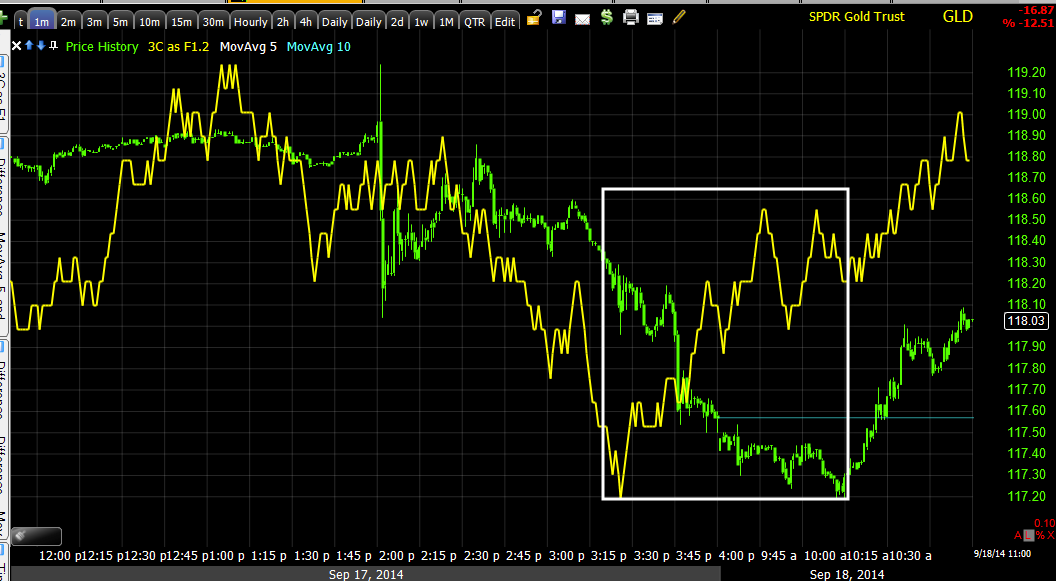
And intraday, gold futures are showing the same positive enthusiasm as GDX , NUGT and GLD.


Closing DUST Long

DUST (3x short Gold miners) was entered as a pullback trade for GDX/NUGT, although I like GDX and NUGT a lot on a primary trend basis, their inability to breakout convincingly of the year or so long base caused us to close our NUGT long at a +40 and +50% gain on the same day it broke out, which had poor signals. It was a good thing we closed the positions on that day as we left nothing on the table as an expected pullback in GDX and NUGT which was the reason for the DUST long, took months to materialize.

As far as why I'm closing DUST at this point, this was a pullback trade, not a trade that was in line with the primary underlying trends. I see some interesting activity in GLD and GDX, which have a close correlation, this morning and GDX has pulled back to the expected area of a pullback, even though it took quite a bit longer than anticipated to do it.

I'm not looking at adding to NUGT right now, although it's a position (or GDX long) that I do like a lot for a longer term primary uptrend, but I think we may be in the area where it will build its base making DUST sideways money , risk and opportunity cost.


The DUST long should come in around a +38% gain, which hedges some of the shorter term NUGT swing long (expected shorter term swing move to the upside).

I'll be looking to add to NUGT, possibly a GLD position , but I think we are early in the process for that, however there is a change in character that tells me DUST is likely spent other than lateral chop.

 DUST intraday negative divegrence

 The same divegrence migrating to longer charts already...

This is the longer term daily GDX inverse H&S base, the white arrow is around where we bought NUGT long and the red arrow on the breakout above the neckline is where we closed NUGT long and shortly after expected a downside pullback which obviously took a while longer to materialize than expected, but did pullback and to the approx. area expected.

 A closer look at GDX daily with the NUGT entry for a +40 and +50% gain, sold at the breakout day at the red arrow. The yellow arrow is where we were getting pullback signals for GDX. We didn't leave anything on the table with the NUGTY sale as the trend went lateral to sideways chop before actually pulling back.

 The longer term DUST 10 min chart shows the approximate area where we were getting confirmed signals of a GDX pullback (DUST Bounce) and you can see that divegrence has deteriorated.

 GLD is showing some interesting activity this morning on a Star (bullish reversal candle) as well as GDX. Look for the daily volume to rise on one of these reversal candles, although I don't expect a "V" shaped recovery, this will likely take a little more time, but probabilities seem to be building in that direction.

 GDX showing the same bullish behavior this morning...

As well as NUGT.

This isn't based on any one divergence, but on broad pullback expectations, the gap fill in GDX/NUGT, the daily candles and recent trend and some interesting bullish behavior that marks a change in character.

Opening Indications

After yesterday's F_O_M_C  red herring of leaving the "Considerable time" language which was clearly for no reason once you listened to Yellen try to explain away the time factor as really not time, but data dependency, it seems clear the language was left to keep the market looking in the direction it had been looking for the last two weeks in fear of the language being removed, the reason of course were the blasted dots.

Both the 2015 and 2016 median F_E_D Funds rate went up again for the two years signaling a more aggressive or hawkish F_E_D, but it seems the red herring didn't do what it was intended to do as the market gave back all of the skimpy knee jerk gains before the close which is one of the fastest F_E_D knee jerk turn-arounds I've ever seen.

It also seems clear that HYG was accumulated and prepped ahead of time for the very concept we have been expecting for weeks and specifically for a pop this week in CONJUNCTION wit expected F_E_D knee jerk support.

That would be the simple concept of a head fake move on a large reversal pattern, more commonly described and drawn numerous times over the last few weeks as an Igloo w/ Chimney top like this...
The drawing or concept has not changed once in weeks of drawing the exact same as far as forward expectations which are the reversal concepts head fake move.

Looking over the watchlist, Set-up plays, most all of them NEED this move, which is why I suspect it's there in the first place as we have suspected for weeks.

HYG is still in control of the market for the moment, although it's clearly lost some of that influence since yesterday afternoon after the DF_E_D gains were dumped right back to unchanged, this is the flat behavior HYG's starting to display after 2.5 days of being locked tick for tick with the SPX.
This morning HYG hasn't moved down yet, but has lost influence over the SPX which I suspect means the averages only have the Monday/Tuesday (part of Tuesday) positive divegrence as gas in the tank which is already running dry.

The key from a market perspective is the market averages' divergences and HYG's as it should lead to the downside. From a "What's the best use of all of this perspective", it's the divergences in the watchlist assets that have been triggering alerts, which I plan to spend most of my time combing through those today while making sure the averages and HYG are moving in the forecasted direction, we haven't been off on this as of yet, probabilities continue to suggest we're still on the right tack so we'll be looking for deterioration in those assets.


Wednesday, September 17, 2014

Daily Wrap

All in all, I could go on for hours about the F_O_M_C statement alone, but one of the best descriptions I've heard was "Double Faced". The market has been worried and discounting whether the "Considerable time" language would be removed which it wasn't, but in the press conference, Yellen essentially mad it irrelevant, explaining that everything is data dependent, so why not remove the date dependent language that was described as 6 months by Yellen at the last meeting, between the time QE ends and the time the first interest rake hikes begin which the market had anticipated to be Q3, now it's looking like the market believes January, but going with Yelen's definition and with it still not removed, it's April.

The market expected the language to be removed, at least until unofficial WSJ F_E_D mouthpiece Jon Hilsenrath predicted yesterday it wouldn't be before backing off his prediction today in saying, only the people in the rom know, yet as usual, he seems to be ahead of the curve as a completely meaningless bit of language that has the market up in arms is left in place, but explained away as irrelevant, unless it's really not.


While the central tendency of the forecasts were slightly lower growth and employment, "But still advancing", the rate out look continued to advance to higher levels, those blasted dots! Actually the dots were not that much of a news item as the number of participants seeing rising rates sooner which is mentioned above.

One thing is for sure, data dependent or not, the F_E_D isn't going to get more accommodative, they haven't even missed 1 target taper, they are moving toward policy normalization despite the double talk and mincing of words. There were a big fat two dissensions, both looking for earlier rate guidance to be put out.

If anything, the F_E_D is getting more hawkish. 14 members now see rate hikes in 2015 vs 12 in June. The median F_E_D Funds Rate is now 1.375% at the end of 2015 vs 1.1125 last meeting. While employment is "still gaining", yet has slowed and economic factors are still gaining, but have slowed, median F_E_D funds rate nearly across the board have risen, that was in fact, the only question that seemed to generate a market response through the entire press conference and a negative one at that. "Why, if employment and economic factors have slowed, have rate forecasts risen?" A more hawkish F_E_D!

In any case, if you back away from the semantics, the double talk, the meaningless (or so it seems) policy wording that is not meaningless enough to remove,  one fact is clear, this is a more hawkish F_E_D and they are not on any accommodative policy trip, they are returning to normalization which is anything but good for the market.

As for the charts, when Yellen first started speaking it seems the F_E_D's NY trading desk sent Citadel an order, Slam the VIX, it went from 13.27 before the F_O_M_C to under 12, but , as I had suspected  by the HYG divergence, the attempt to tamp the market on a knee jerk reaction backfired.

 While our minimum upside target from last Friday's "Week Ahead" post was met, the break above the SPX's downtrend which isa technical breakout/buy signal, intraday the SPX nearly saw new highs and then walked back all F_O_M_C gains despite HYG support tick for tick and a coordinated VIX slam the moment Yellen started talking.

The averages on the day since the F_O_M_C looked like this...
To the far left are all 4 major averages at the 2 p.m. policy announcement, first dumped, then pumped and then dumped again giving back all post F_O_M_C gains.

Here the SPX takes a slightly different, albeit weak read on the minutes while bonds (blue) have a more hawkish interpretation.


As seen above with TLT, yields across the curve (5, 10 and 30) all gained post F_O_M_C and managed to hold a good bit of it, a different interpretation than the knee jerk up in stocks that was one of the weakest knee jerks despite HYG and VIX support, which ended losing the gains.

The $USDX reacted as you might expect. Do you recall the drop yesterday in the $USDX and me showing that happening in to a positive divegrence in last night's Daily Wrap? Well apparently there was something to that as the $USDX hit 4 year highs today.

 Yesterday's shellacking in the $USD is barely evident vs today's gain and a strong 15 min positive divegrence yesterday, perhaps there was some inside information floating about?

And this sent the USD/JPY to > $108, too bad about that Index future/ USD/JPY correlation failure, we'd be sitting on SPX $2500 right now.

As the $USD gained, we saw more evidence of the historical $USD Legacy Arbitrage relationship, gone missing for 5 years, start to re-emrge (remember, those who figure out the new dynamics of these changes of character win)...
While retail and the financial media go on about the "New Normal", another way of saying "It's different this time" during a bubble, I see the old correlations roaring back. Commodities dumped on the $USD strength today just like you'd have expected 5+ years ago before the F_E_D's experiment.

All in all the SPX gained +0.13%, the Dow and NASDAQ 100 gained +0.15% and the Russell 2000 gained a paltry +0.25%, one of the most pathetic market days, much less F_E_D knee jerk days I've ever seen.

As for Leading Indicators, you saw how HYG led tick for tick, the SPX...
 HYG (blue) vs the SPX (green).

And the longer term, as I said during the divegrence, "Nothing is going to save HYG from making a lower low.

High Yield Credit is making lower highs/lows while the SPx made the move above the channel we were anticipating. HY credit isn't manipulated like HYG short term, but be sure HYG will follow HY Credit as they can only hold these levers so long before facing massive losses.

In fact, end of day it looked like they may be giving up on the HYG divegrence long before it's due...
While realistically it's too early to say, this is the first negative divegrence in HYG and about the same time the VIX slam failed as well as TICK made lower lows. Tomorrow should be enlightening about short and long term trade direction.

 Our pro sentiment leading indicator was up yesterday in advance of today's action, but in to today, all downhill.

I speculated earlier in the week that the SPX would make a move toward our leading indication using yields, it looks like we were right on as it reverted exactly to the mean.

Now for some interesting stuff... Breadth... 

As far as a Dominant Price/Volume Relationship, the Dow has 13 in Close Up/Volume up, the most bullish of the 4 relationships, but also a 1-day overbought signal. The NDX had 45 in Close Up/Volume Down, the most bearish of the 4 relationships. The R2K and SPX had no dominant relationship at all and there wwas obviously none between the 4 major averages making it virtually a moot point.

Of the 9 S&P sectors, 4 of 9 closed green with Materials leading at +.605 and Energy (probably due to the strong $USD) lagging at -.55%.

Of the 239 Morningstar Industry/sub-industry groups, only 110 closed green.

Here's where it gets interesting... "The Percentage of All NYSE Stocks Trading 2 Standard Deviations Above their 40-day Moving Average" (momentum stocks) went up from 4.6% yesterday to 5.55% today, down from 33% in June.

"The Percentage of All NYSE Stocks Trading 1 Standard Deviation Above their 40-day Moving Average" saw a meager gain from 15.5% yesterday to 19.6% today, down from the average of 56% in July.

It just gets worse from here... "The Percentage of All NYSE Stocks Trading Above their 40-day Moving Average" made a meaningless move from 335 yesterday to 33.33% today, down from the average of 75%

"The Percentage of All NYSE Stocks Trading 2 Standard Deviations Above their 40-day Moving Average"  went from 27.72% to 27.56%, down from the June average of 60%

And the "The Percentage of All NYSE Stocks Trading  Above their 200-day Moving Average"
went from 56.65% yesterday down to 56.03% today, down from the July average of 74% and the "The Percentage of All NYSE Stocks Trading 1 Standard Deviation Above their 200-day Moving Average",  again down from 27.72% yesterday to 27.56% today.

Unbelievable moves or failure to move in breadth, despite the paltry gains in the market.

The HYG divergence is really one of the only things to watch as it has been the only real support as you have seen for the market, if that divergence has ended, we don't have much of anything to keep this facade of a market up.

Remember tomorrow we have the Scottish independence referendum and Friday we have Quadruple witching, wouldn't it be odd if either of those events created more volatility than the F_E_D today.