Thursday, November 20, 2014

HYG Update

I'm trying to gather as much data as I can for market timing purposes, I honestly can't say that I would bet against the probability of a sharp drop, stronger than this rally. I personally will NOT try to trade around even a 1- day upside move that I feel as certain about as I did the GLD drop yesterday morning. Personally, I'm all in, if I had any more dry powder, I'd be using it now regardless of timing as the macro trends are overwhelming. It's sort of like losing that AAPL -45% decline I had been making a painful case for as everyone loved AAPL at the time as it hit new highs, simply because I decided to chase a small bounce rather than just stay in the short position, a painful lesson to this day.

However I want to provide the best information I can for you as I know we have all kinds of traders, investors, managers.

I was concerned with some HYG charts, however they may already be resolving themselves. 

I wanted to do a macro update with as much information as possible, but things are NOW moving exceptionally fast so charts I captured 5 minutes ago may look different and I'll try to give you the most updated information I can, thus I have to break up these updates.

*The caveat is, while short term charts are moving quickly as I perceive a near term exponential increase in volatility, the MACRO charts are not changing, they are the highest probability, they are far beyond historical norms in uncharted waters, thus at this amount of destruction in them, they could literally break any minute- again because they are well past any historical precedent which also means they are likely to produce a move beyond historical precedents.

HYG was causing some concern, even though HYG didn't close green the last 6 days, intraday it has supported the market.

 HYG intraday again today below yesterday's close and red here at the capture, but moving in support of the SPX (green). It is currently at dead flat 0% which is an improvement from this capture which shows yesterday's close as a red hash mark.

The charts of concern...
 This 10 min chart in to a rounding bottom, not a big base, not a base that can support much of a move, but a base all the same and positive at that.

Since my concerns, the 10 min chart has been moving leading negative intraday which is a large move for a 10 min chart intraday,  thus the issue may be resolving a;ready and no longer a cause for concern.

Intraday note the positive divegrence as support for the gap fade trade and through the day the intraday chart has been declining, it hasn't migrated to a 2 min chart, but the 10 min chart speaks volumes.

I'll be updating as much as I can as fast as I can and in a comprehensible and useful way, but likely independent updates, at least through normal market hours.


IWM Charts

I'm trying to complie data as fast as possible, but as always, intraday charts are subject to fast moves and they are often important moves.

One cause of concern I have is HYG charts, they look stronger (3c) than I'd expect, yet at the same time they are seeing distribution through early timeframes suggesting the possibility of HYG being there, intraday to support the market this week including the head fake move, yet still not putting HY credit traders in danger as HYG has closed lower the last 6 days, yet it's something I always want to keep an eye on.

None of this changes any macro or highest probability expectations, this is shorter term in nature.

In any case, these are the IWM charts that I mentioned along with some others.

 Ear;y this morning I mentioned some positive divergences and the possibility of fading the gap as an intraday trade, you can see the positive divegrence in IWM which is more a function of the gap down, it's probably easier to explain in market maker/specialists terms, as of the close last yesterday they had inventory near the closing levels, as of this morning that inventory was at a large loss, thus the gap fill to unload yesterday's inventory near closing levels. This likely explains the VIX smash and dash early today, some of the TLT and certainly HYG action.

This leading 1 min chart is quite deep and fast developing.


 In this 2 min chart's IWM trend which went negative at the IWM's exact high and has stayed PERFECTLY in line with a downtrend since, has seen negative divergences at the head fake (suspected) move of Tuesday and again today there's no support as 3C continues toward a lower low, keeping the trend/price confirmation neatly intact.

However with op-ex (monthly) tomorrow (I'd like to see where some of the calculators are calling max pain, I'd suspect that pin would be lower as bullish sentiment would most likely see more call buying by retail)  and increased volatility since the Nikkei's Sunday night plunge and just after its dead cat bounce (today's open), there's the rising probability of that VIX Bollinger Band Squeeze and buy signal sending volatility soaring higher, of course the market trades in the opposite direction of VIX.


 The 3 min IWM chart also seems to be taking any opportunity at higher prices to distribute (which includes selling short as it is a sale across the tape).

And this is the institutional timeframe of 5 min, the fastest timeframe in which we typically see larger institutional transactions intraday, clearly negative as well.

This is the intraday TICK just as the IWM was starting to see some downside with TICK falling out of the channel and hitting a -1100 low, that's a serious batch of selling quickly in the afternoon when institutional traders are most active.

I see there's a bit of upside volatility since this capture right now around +750.

 Interestingly and I've been watching this closely, you may recall breadth indicators for the most part have not moved at all in about 12 days, over 2 trading weeks, thus I wouldn't expect to see a lot of movement on the custom TICK trend indicator, however, today we see the early positive trend movement and later negative trend movement throughout the day.

Remember with multiple timeframe analysis the shorter charts are going to reflect short term activity while the longer charts are reflecting highest probabilities and larger moves.

Thus the recent rash of deep negative TICK readings just before and in to the (suspected) head fake area and after, are the first significant reading showing a strong change in breadth for the entire trend.


Intraday Update-IWM sharply NEGATIVE

I'm preparing a more comprehensive, important near term update, but meanwhile IWM intraday chart just went VERY negative very quickly. Look for downside

UNG Follow Up

Yesterday this UNG Update was posted. After a move +3.86% higher, many were interested if a pullback was still in the cards to either enter long UNG/UGAZ positions or to add to them.

I covered most of the macro-dynamics of UNG in yesterday's post so I won't repeat that today, but we were also looking at the 3C charts and came to the probability,

"The charts now suggest a resistance area has been hit, remember tomorrow morning the EIA releases Natural Gas inventories...So we are looking for a pullback in UNG once again...

Right now the last pivot high saw minor distribution on a 15 min chart, but as we approach the same resistance level, 3C is not confirming, suggesting all of the gaps recently made below, are likely to be filled in a pullback from here."

Today UNG has started that pullback, down -2.33% and showing positive signals which is what we want to see in to a pullback (institutional accumulation).

The current UGAZ long is still at a 19+% gain, I'm not interested in trying to trade around this one so unless something dramatic changes, I'll just leave it open and treat it as an early trend position.
 Yesterday's daily chart demonstrates the principle of candlestick reversals on higher volume just discussed in the USO update, a concept that is universal through assets and timeframes.

Note the Doji Star at resistance yesterday on increasing volume (churning) which is an indication on its own of a reversal even without the candlestick reversal, but with the candlestick and volume, the reversal's probabilities rise by multiples.

The gaps seen yesterday as potential targets are obvious, there is support (Tweezer bottom) at the top of the orange range, the bottom being a gap fill.


The very same ROC on price principle I talked about yesterday worked just as well for this pullback and is showing positive action in to the pullback as we want to see, but no reversal process yet which should be roughly proportional to the preceding trend (pullback) which is yet to be determined.

Since we have already seen an impressive breakout and consolidation, I suspect we are just about ready to see UNG/UGAZ move up in a much stronger trend and break above the the failed range of January-Jue 2014, thus I'm using a 2-day version of the X-Over Screen which has just given all 3 signals for a new long/buy signal. The first pullback after a new signal is almost always the 10-bar moving average in yellow, thus a 20-day moving average as this is a 2-day chart, this is around our other target areas as well.

At the first sign of a trend, I would continue to use the 2-day X-Over Screen and we'll establish the appropriate Trend Channel stop once a trend is clear.


 As shown yesterday, the 15 min chart was positive at the previous pullback I had warned was coming and would be a good buy area, we also see the divegrence at the resistance area. I fully suspect this 15 min chart will be repaired and positive before a move higher which means some sort of "U" or "W" shaped reversal process, so I suspect we have some time before an upside move, but this may be a good candidate for considering phasing in, not the same as averaging down a losing trade as your risk management reflects the averaging in approach before you enter the first order.

 The 3 min chart shows similar things on a smaller scale, the point being is I expect this will be clearly positive as well by the time UNG is ready for a pullback purchase which is one of my favorite kinds as we get to verify the constructive pullback first, before any entry.

Finally the intraday 1 min is showing a positive divegrence, this is the small process of divergences that accrue and eventually migrate to the longer timeframes above,  so thus far this looks like a constructive pullback being accumulated by deep pockets on the discounted pullback.

Oil Trend Changing...

This is one longer term trade that may very well be worthwhile. Personally I think there's a pretty good chance of a smaller swing trade to the upside, but I believe it is part of a larger range forming or stage 1 base. I personally wouldn't quite be interested in a long unless we had a head fake move below very recent support, however the trend is clearly changing, I can't give you the fundamental reason why it should change, especially in light of Global PMIs today, but something is clearly changing and with a little leverage, this may make for a very nice position trade.
 USO Weekly chart. "To make money you must see what the crowd missed"

What I see is a near textbook, classic Double Top, the measured price pattern implied target is nearby, roughly $27. The large volume recently is a concept we see over and over again on just about any timeframe chart. Look at our exit from DGLD yesterday, it was at the exact bottom and the reason why was increasing volume. This is a clear change in character and changes in character lead to changes in trends.

Even the weekly candlestick pattern is a bullish reversal pair called a Harami or "Inside Day" with a Doji star.
The only thing missing to make this candlestick reversal pattern super high probability is a rise in volume on the 2 bars, however,  I believe that reflects the fact that the base area is not complete or "in the works".

 
 Using a large 2-day Trend Channel that holds the entire downtrend, the downtrend stops out at $30, it may be even lower than that in a few more days as the Trend Channel continues to lock in downtrend gains.

 Look at the down trend line and the recent support clashing together, a few more days and the down trend could be broken here as well.

This is the 2 hour 3C chart clearly showing a top of a H&S type nature, although the neckline could be drawn several ways, the distribution through it is unmistakeable as is the down trend confirmation and recent positive change in character of 3C.

 The exact same is seen on a 30 min chart.

S3= a stage 3 top, S4 = stage 4 decline and the next stage in the cycle is stage 1 base, which it appears is taking hold.

 The 10 min chart has a rounding bottom and a positive divegrence, this is the reason I said I thought there's a good chance of an upside swing trade, but I think it has a roof as it in effect, carves out a larger base range.

 The 3 min chart shows the same so it does look probable that a swing move up starts soon, to even consider this I'd want a head fake move below support for a better price, but mostly to reduce risk. This really isn't the position I'm envisioning though, it's a much larger one as the base looks more complete.

The 2 min USO chart is negative and suggests a pullback and possible head fake is a probability, thus I did not put this out as a trade idea (even as a swing trade) yet.

There's also confirmation in Crude (Brent) futures)..
 The daily Crude futures chart shows 3C negative at the very highs of the last trend, the positive divegrence isn't big enough to show up here yet, but remember the concept of "Migration", so the next longest timeframe for futures I use is the 4 hour chart.

This not only shows perfect 3C confirmation of the down trend, but a positive divegrence which is likely to migrate to the 1-day chart above with a little more base work.

If you are interested in a possible swing trade, let me know. I'll be setting price alerts for a head fake move below local support (60 min chart).

Fade Divergences are Worse

The market divergences are taking effect, now just to determine if there's any pin involved, but I suspect most options are calls and thus a move lower makes them worthless tomorrow.

In some way, just about every ramping lever that could be used was used, apparently for a gap fill, but the opening almost always is a reversal of the pre-market trend. Typically there are at least 2 to 3 intraday trends through the day so where we go from here and what the usefulness of the trend right now is, is important.

The VIX, as you probably saw had some "erratic" behavior this morning to say the least, smashed higher, while VXX short term futures outperform the SPX. HYG intraday was employed until the gap fill as well as a pullback in TLT, not exactly the SPY Arbitrage, but all the same movements, obviously supportive of the fade/gap fill as TLT's pullback and 30 year bonds sent yields higher.

The ramping assets seem to be fading off with TLT putting in a positive divegrence now, HYG stuck in the red at a flat range, no longer moving higher, Yields should reverse with the 30 year bond/TLT , as mentioned VIX short term futures are outperforming and the divergences in the averages are worse and worse.


Volatility is plainly increasing in the market as today's open took out the lows of the last two days in every major average except the IWM with the VIX smash coming just after the open.

A few quick charts and since US PMI just missed making it a global full house, I thought I'd throw in Dr. Copper and for others, their preferred Dr. Lumber....On a side note, thus far Financials look like they are showing real relative weakness.

The divergences are not only stronger in time and depth on intraday 1 min charts, but more importantly migration as they move to the 2 min and longer charts. Lots of whiplashing going on with increased volatility, remember the market NEVER makes it easy or obvious.

The averages...
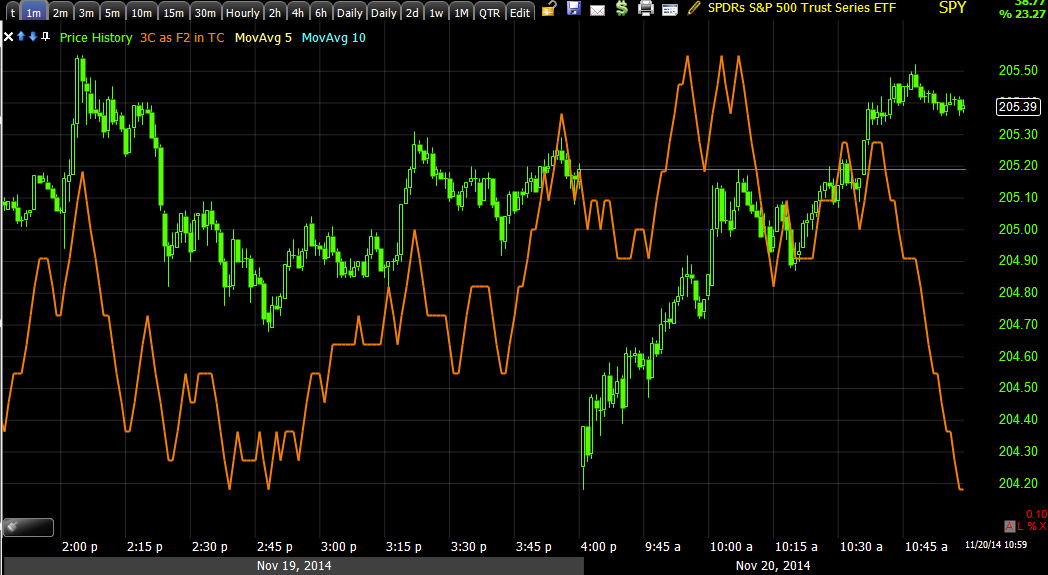
 SPY deeper intraday 1 min negative

 SPY migration to the 2 min chart with a deep leading negative intraday.

 QQQ 1 min

QQQ 2 min migration

 IWM 1 min

IWM 2 min

The Levers...
 VIX vs SPX (no inversion), VIX is smashed and trashed, yes...This looks like normal, non-manipulated trade...(sarc)

However the short term VIX futures vs inverted SPX (green) are outperforming.

Volatility is still bid. Don't forget the VIX buy signal, 1 of 3 signals in the last year and a half, the other two were dead on and the Bollinger Band squeeze.

 HYG used intraday, but still red on the day

HYG's divergence...

The levers are giving out.

TLT used intraday on the pullback and 30 year to send rates higher.

30 year yields gap lower with the market (normal) and then higher on bonds pulling back, however...


TLT has an intraday positive divegrence on the pullback and 30 year Treasury ,futures...


 Are also regaining 3C support.

As for Dr. Copper and Dr. Lumber, the forerunners of market analysis, thus the title "Doctor"...
 If you have heard of "Dr. Copper" or the newer Dr Lumber, then you know what these mean, copper above, Lumber below.


Fade Trade Update

The gap fill in the averages (which in 3 of 4 took out the lows of the last 2 days on the open) is coming along with intraday negatives as the averages pass the gap area, they seem to be getting worse so I figured a warning is appropriate and I'll update further weakness. Thus far here's what they look like...

 SPY intraday 1m

 QQQ 1m

IWM 1 m

The SPY divergence especially has been moving the fastest.

Global PMIs Tumble / ES & USD/JPY Correlation Break

Yesterday I said I thought 30 year bonds (via bond futures) were likely to rise as there was a strong positive divegrence in 30-year bond futures, this morning they have...
The divergence which was in place during regular hours yesterday turned in to an upside move overnight as Global PMIs came in very weak.

Japan came in with a miss at 52.1 and China's Manufacturing came in with its 13th consecutive miss to expectations and printed at a 6 month low of 50 (below 50 is contraction). Output in Chinese PMI manufacturing was one of the hardest hit of the sub indexes at a contractionary 49.5.

While both the Shanghai Composite and Nikkei 225 closed up 0.07% each, things have turned decidedly worse for Nikkei futures as well as USD/JPY since.

From yesterday's 4 p.m. cash close, Nikkei 225 futures have now fallen over 300 points which means the crack in the Nikkei with a nearly -3% day as the week's trade opened, which we predicted Sunday night would see a dead cat bounce followed by a return to the macro trend theme of down, is  in play.
 Nikkei 225 futures from Sunday night with a steep decline of nearly -3% followed by the dead cat bounce expected and now turning down on a large , nearly 3 day negative divergence on a 15 min chart, joining the macro theme negatives as it looks like the Nikkei may have just cracked.

The unstoppable devaluation of the Yen with Abe at the helm, pushing Japanese citizens in to the poor house, sent the USD/JPY just short of the 119 level overnight before reversing course and moving back below 118.
USD/JPY since last Friday with the overnight downturn after a new high. This downturn ironically was on yesterday's predicted bout of Yen strength as a short term positive divergence formed, the Yen has seen overnight gains since reaching its 2 a.m. lows.

However as we saw on Tuesday which I suspect was a head fake day in the US markets, the Chimney on the Igloo (rounding top) which is a theme we see at least 80% of the time before reversals in any asset and any timeframe and usually leads directly to a reversal, the US markets have decoupled with USD/JPY and badly...

 The overnight USD/JPY(candlesticks) vs the SPX futures (ES) in purple, it may seem like ES is in line with USD/JPY on the downside and maybe it is, but it certainly wasn't as the USD/JPY moved to new highs which conventional wisdom would have easily predicted the SPX moving to new highs with it overnight, but something changed ever since Tuesday when US averages ran ahead of the USD/JPY in what I believe was a well timed head fake move and then ran below the correlation in what I believe is likely the start of a major break as the head fake move appears to be in (it was confirmed distribution by 3c).


This longer chart of this week gives you a better perspective of the correlation intact in to the open of trade this week, Tuesday's run higher on an apparent head fake move in ES and yesterday's utter failure of ES to meet new USD/JPY highs which has only gotten worse since as the USD/JPY has moved to a new high overnight and lost that.

Carrying on from the Asian session, Global PMIs continued to disappoint. How many years did we talk about the European periphery in terms of the PIIGS (Portugal, Italy, Ireland, Greece and Spain) while the core (France and Germany) remained unaffected and bailout after bailout of the PIIGS was meant to keep the core from sliding in to the funk the PIIGS were in. Well after yesterday's strong German sentiment (manufacturing) in the ZEW poll/index, today's real numbers in the form of PMI show that not only has France slid in to recessionary territory (this happened some time ago), as it printed a contractionary manufacturing PMI , but Germany printed at 50, just 1/10th of a point away from contraction in manufacturing, although Services missed globally across the board as well.

Germany's last was 51.4 so 50 is a steep slide for a month and consensus was for a better print of 51.5 and down from a year ago at 52.7. 

The Euro-area Composite was no better news at 51.4, 16 month lows.

The main point however seems to be the crack in the market via the Nikkei Sunday night which was forecast to see a dead cat bounce in Sunday night's post, Abe and Kuroda'a QE-Zilla Sends Japan in to a Triple Dipp Recession...

"With such a sharp sell off in the Nikkei 225 futures, I expect some kind of dead cat bounce to be likely as the 5 min chart seems to indicate, but the macro theme should reassert itself taking the Nikkei futures lower."

" I expect that the macro theme will reassert itself after a dead cat bounce which may coincide with the Week Ahead's early strength Monday fading in to weakness through the rest of the week."
*From Sunday night's post linked above

...has returned to the weakness that I suspected was only the first crack in the market with the trend following the dead cat bounce to lead us lower and you have to admit, in the interim we've seen a textbook reversal process via a head fake move with distribution and a total dislocation of the main US Index future ramping asset, USD/JPY.

All of the signs have been there... Of course I'll continue to look for the message of the market and post anything contradictory to this thesis which has been held since the first week of October when a strong bounce was predicted with a stronger decline following it also predicted.

It's hard to ignore these macro trends everywhere, they are screaming red flags and not our typical divergences like the ones that led to the August bounce or September/October decline or even the strong October rally, these are huge, much larger than anything I even recall seeing and more consistent through every indication we use.


Fade Trades

This morning's gap down on horrible Global PMIs is volatility on the rise, when that happens, unexpected things happen and small divergences often get run over.

I'd like to see this morning's opening indications as some of the gaps have taken out the last 2 days trade, but if I were to engage in fading the opening gap, it would be in the SPY and maybe the IWM, not so much the QQQ at this point until we see something. ES and TF at least have small intraday divergences on the open, NASDAQ does not, but again, these small divergences are easily overrun when fear takes over.

To be on the safer side, you might look for at least a intraday double bottom before attempting an upside fade and I wouldn't be attached to it too long....