Thursday, February 5, 2015

USO / Crude Update

Other than a couple of posts dealing with the USO/Energy Sector/MArket influence and Crude Inventories, this was really the last update of significance as to USO/Crude's action, expected action and mass psychology as it relates to USO and what is likely to come next.

From Tuesday, February 3rd, USO Update

"Oil is now on track for its 4th consecutive daily gain and it appears, as usual, the bottom callers are in, just in time for what should be a little consolidation which will likely kick them out of the trade and turn them bearish again just as USO makes another leg higher.

Other than the Mass Psychology of calling the obvious long after it has occurred and taking it to an extreme of a "Bottom", which this clearly is not, the market is finally noticing what we have been forecasting for weeks, but it does look like we are at an area of natural consolidation, one I'm sure will be interpreted as "Oil is not at a bottom, it was a false start"."


The mass psychology of all of the bottom callers who didn't call a bottom, they saw price move up and went overboard including Cramer, which was nearly as wrong as you could be in his timing, oil only moved a little higher after his "Smell a bottom" comment, I get how retail gets over-zealous, calls a bottom and has no idea why this should be a potential bottom (No fundamental evidence, no technical evidence), all they see is what price did last and they chase that and make assumptions which is about as far as you can get from objective analysis, it's emotional group think.

The pullback in oil was almost perfectly timed with the master of retail thought, Jim Cramer's off base comments about smelling a bottom. At that point you could use mass psychology and no other technical indications other than the increased ROC of price to the upside following his comments, the "seemingly" bullish... RED FLAG, to call a pullback.

My thoughts on oil/USO have been that we'd see a sharp rally, a short squeeze, a counter trend rally, but as of yet, no evidence of a bottom. I still think we have plenty more upside to go and as retail who was busy calling a bottom Tuesday quickly changes their tune over a pullback/correction in USO/oil, they are adding the additional short exposure that will ramp USO even higher on an additional short squeeze.

As for the charts, I was watching them today and the gains in oil, I didn't put out any calls for a possible new long trade/ entry because I suspected that we'd see today's move fade, it's just not big enough in a single day of correction to support the additional gains that it is capable of. Understanding how crucial a base is to supporting a move is one of the best uses of your time simply by going back and looking at historical charts. You'll develop a feel for the original base, the trend and what a proportional correction is likely to look like.

Here are the charts I think are most important.
 This is the daily USO chart, in regard to a base...

This is what the 2009 USO base looked like and it didn't even move much after, but look at the size compared to now.

 This is the 2 hour chart for USO from distribution to confirming the downtrend to a leading positive divegrence.

I'm not saying this couldn't turn in to a base, but there's no objective evidence of a base now, which shouldn't discourage anyone as a counter trend rally is going to move faster and further in that time than a base and a new trend, it just won't last.

 USO 30 min and a leading positive divegrence, the main point so far is there's no damage to the chart, suggesting additional upside, in fact from my expectations for this move, we've barely started.

 The 15 min chart shows the base and an increasingly strong positive in an intermediate timeframe which is more of a timing divergence than a 30, 60 min divergence, in addition all price moves have seen 3C confirmation so again no damage to the charts even in an intermediate term timeframe.

 The 5 min chart shows the increasingly positive divegrence/base as it head fake/ran stops and at #2 we have the typical 4 stage cycle mark-up and at 3 the distribution phase which is less top and more pullback.

The lows from yesterday saw a positive divegrence, but in my view this was simply too soon for additional upside without more consolidation.

A close view of the 3 min intraday chart shows that base at the lows or positive and the run up today as well as the rounding over on a negative divergence. It would not be uncommon for price to move back to yesterday's lows or even lower and build a stronger pullback base to start the next leg up from.

Crude Futures show broadly the same thing, although timeframes differ a little.
 4 hour (CL) Brent Crude Futures with the negative sending crude lower and the recent positive like USO.

The 15 min chart, a small positive divegrence, in my opinion not large enough to support a strong next leg higher and in line on today's move.

The more detailed 7 min CL chart shows the negative in to yesterday and in to today's highs.

In my best guess opinion...
Using our X-Over Screen, it would seem reasonable for price to consolidate along the yellow 10-day and blue 22-day moving averages before the next leg up, we just need to watch for improving near term (short term charts' leading divergences) strength, but this general area along the 2 moving averages seems about right in terms of depth and time.


Technology/ XLK

We've covered Tech before, it's not a pretty sight, there have been some significant trend changes recently and in to 2015, I'm giving you a look at some of the background, longer term charts just to get your bearings, what I'm really trying to point out is the strange behavior today and it showing up in Tech which I do like as a longer term position short, whether short XLX , using the leveraged TECS (3x short Tech) or just broad exposure via a QQQ short or leveraged ETF derivative like SQQQ (3x short QQQ).

 XLK/Tech Daily chart, note the clean uptrend and then the increased ROC to the upside peeling away from the trendline, this is the "seemingly" bullish activity that is almost always a red flag warning of an impending change in trend (orange arrow), suddenly there's a big change in trend with the first major lower low in well over a year followed by a more lateral trend that if you look closely is a series of lower highs and lower lows.

 Here's a closer look and as far as the most recent swing to the upside, note the candlesticks and volume.

 The long term 2 hour chart goes from confirmation to a sharp negative divegrence leading to the break of the trend and since the lateral Q4-2014/Q1 2015 downtrend, note the leading negative divergence and this is a serious time frame at 2 hour.

 The 60 min chart may look slightly different, but the signals are exactly the same, the negative in to the big dip at the October lows and a leading negative divergence since in to a lateral trend with lower highs/lower lows, a downtrend.

While a major break has not occurred since the October lows, if you look at XLK from the October lows/base/cycle, it's clearly rounding over in the trend of lower highs/lower lows.

That's kind of the background information, the very negative tone in Tech.

At a 15 min chart it's not only leading negative, but you can make out each of the negative divergences at the series of lower highs.

 The same is true of the 10 min chart, just to show we have what I'd call a full house through multiple timeframes.

However for the current activity rigt now and today's strange trends, check out this 2 min chart showing the most recent base area since the 14th-16th's failure and note today's activity specifically on this 2 min chart, seeing sudden and seemingly pretty strong distribution.
XLK 2 min.

The average that would be most effected my this would be the Tech heavy NASDAQ 100/QQQ.

Here's the same 2 min chart in QQQ today...
I don't think that's coincidence...

Market Update

We are green for 2015, well at least for a bit today any way.

The market continues to have a very strange look about it, especially intraday breadth. To me it looks like intraday charts and price action are starting to roll negative.

 While the chart is not SCREAMING or jumping off the screen, the intraday SPY (1 min) continues to deteriorate.

Other than the opening ramp, there hasn't been much activity the rest of the day, see the R2K futures below...
The overall negative tone trend pops out on this intraday Futures chart of R2K, but also note that beyond the opening ramp, not much has happened since.

 The SPY 2 min is showing some change in character as well, it isn't screaming at this point, but it is moving in that direction at a pretty steady pace.

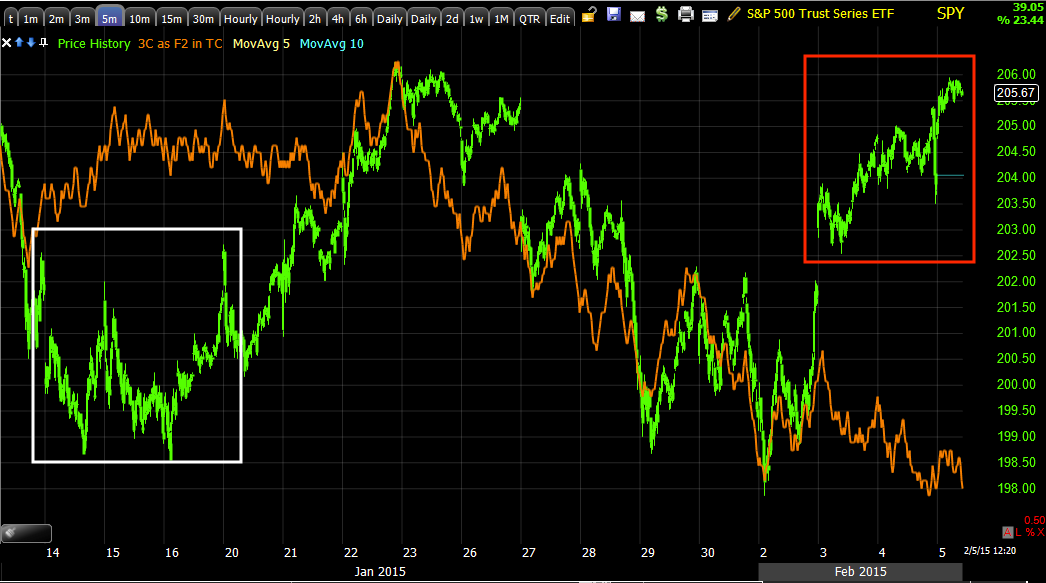
Of course the highest probability for the resolution of this move is seen in all of the averages on their 5 min charts, this is not good as this is one of the earliest, serious timeframes, 5 min which is what I consider to be the earliest timeframe showing institutional activity.

 The SPY trend since the October cycle has also shown very clear deterioration, especially since 2015 started.


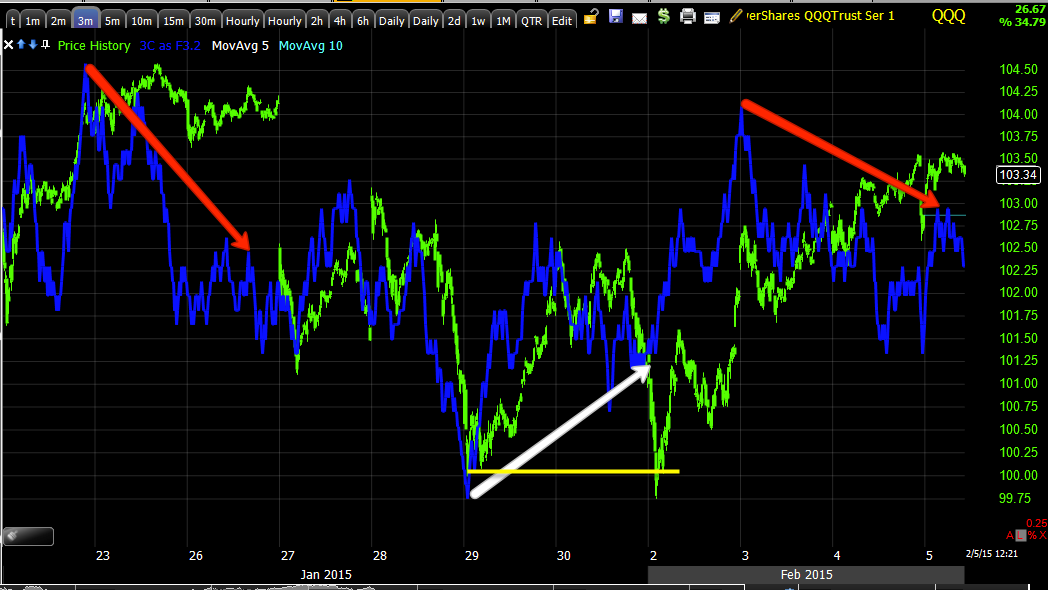
Q's intraday are showing similar consistent negative activity, while not screaming or jumping off the chart, if it keeps this up, it won't be long before it is screaming and popping off the chart.

 QQQ 3 min which is where the positive divegrence reached for this most recent swing in the large choppy range is also clearly turning negative.

And the 5 min chart with the reversal process.

I put the 10 min chart in the post just to show the reversal process, sometimes we watch the market so closely we expect things to happen faster than what is reasonable, so I thought I'd show you what has been reasonable in recent past reversals.

Note that each top side reversal is proportionate with the preceding trend, the larger the uptrend was, the larger the topping reversal process. Also note that as usual, downside reversal areas are almost always much tighter than upside reversals, this has been something we have seen for a long time and nothing unique to this particular market/time period.

The overall trend of the 3C chart is probably one of the most important pieces of information on this chart.

 IWM 1 min is also acting like SPY/QQQ today, which is uncharacteristic for recent action on the timeframe.


 And the 3 min IWM in the chop range and the different cycles including the 6th, the 14th-16th and the most recent one as well as their distribution areas and reversals.

 And other than the 5 min chart leading negative in the most recent cycle like all of the other averages, again the most important data on the chart is the trend of 3C through the entire zone of chop.

Sometimes these choppy ranges can be bases, but I think we can rule that our judging by the 3C trend through the range.

And what is grabbing my attention most today as a "Strange market" is the NYSE TICK, usually there's some trend, this trend is pure lateral, no extremes in the TICK at all, pretty much in a very tight range between + and - 500. Very odd.

MCP Update

This was yesterday's MCP post, it describes essentially what happened, what we'd like to see happen next, etc, MCP Closing Update.

As for today, MCP is showing some productive signals, although I wouldn't call them the kind of signals I'd enter a new trade on, but moving in the right direction so far.

A consolidation, whether it be through price or through time is usually more than just a 1-day event, especially after a move of over 200% in just over a week so several days of consolidation are realistic, it also gives us the time needed to see if the initial improvements seen today continue to develop and turn this consolidation in to a new high probability opportunity.

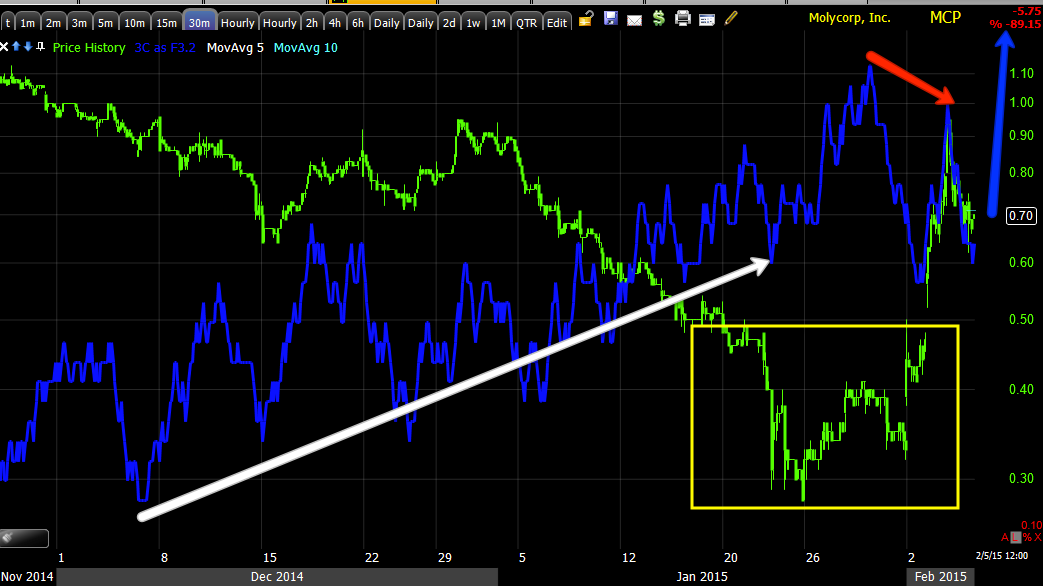
 The probabilities for additional upside in MCP are still high as this 60 min chart is leading positive. We'll want to see the chart stay that way and maybe even improve, we don't want to see it deteriorate.

 I drew in an additional daily candle on the 1-day chart, at bare minimum I'd prefer to at least see another day of consolidation in the area with a bullish reversal candle or multiple candle formation.

I drew in a Doji Star in yellow which would be an acceptable candle in and of itself, but notice I also drew it so that today's lows on a bullish hammer and tomorrow's on the star form a 2-candle reversal (bullish) known as a "Tweezer Bottom" in which the intraday lows of today and tomorrow are nearly exactly the same. There are numerous other forms the candlesticks could take and still be a bullish signal and it could be several additional days as well and still be bullish, this is just a broad concept of what would be nice to see at a minimum (at least 1 more day of consolidation).

 The 1 min intraday chart shows the negative at yesterday's highs which we had warned about in advance of those highs and today's action shows a relative positive divegrence, we'd want to see this strengthen significantly and lead positive.

The 3 min chart shows the same basic signals of a negative at the highs and a positive tone since on the pullback, again, we'd want to see this continue to improve, the extra time (day +) would give MCP the change to demonstrate that improvement on the 3C charts.

Here the 5 min chart isn't negative today nor is it very positive, it really hasn't moved much. I drew in a blue arrow of the basic concept of what I'd like to see in 3C, some sort of leading positive divegrence, especially in to another day of relatively flat prices.

And the same holds true for the 30 min chart which hasn't moved much yet and that's not surprising given the short time we've had since the consolidation, but again I'd like to see 3C move to a more leading positive position and at that point we'd want to look for that bullish reversal candlestick on heavier volume than the preceding day, that would likely be our high probability entry.

These are some of my favorite trade set ups as price and 3C must prove themselves first before you take a position (unless you are holding in which case the 60 min chart is still the highest probability resolution (to the upside).

So far, everything looks pretty good, I'm actually surprised we haven't seen a deeper pullback, but as I said, consolidations can take place through price or through time (sideways).

Strange Looking Market

I'd call this a market update, but I think the title above is more appropriate.

It seems to be pretty clear that there's some element pushing for the green form 2015 theme that was given up yesterday, but as we make that happen this morning, there are some strange looking charts...

 QQQ 1 min

QQQ 3 min recent trend in to today's highs.

And the 5 min that has been in negative position.

 and Index futures intraday are going negative on their charts...NQ 1 min

The SPY has a strange look to it


 The IWM is seeing a deepening leading negative divergence that I've been watching and maybe strangest of all...

Look at the NYSE TCIK, I would not have expected such a flat, tight range in intraday breadth.

Something looks awfully staged or mechanical here.


Opening Update

So far this morning, other than mass loss of central bank credibility , mostly in Europe with the Swiss National bank buying EUR crosses all morning as their soft ceiling for the Swiss Franc fails, and of course the ECB acts as a political power broker in strong arming Greece... it would seem the market is bounce to go green Year to date as it was headed and achieved yesterday before the ECB news came out, that "Green for 15" looks to be the same theme this morning so far, but some interesting cracks are emerging or in some cases have just been in place.

As for Index futures, they were already seeing deterioration which was documented yesterday through just about all timeframes, today as price returns to the scene of the ECB tantrum late yesterday, we have clear divergences developed, these are the definition of a relative divergence ...the same relative area for price, but not the same for the indicator (3c).

 NQ 5 min shows the deterioration that was already in effect yesterday long before the closing hour when the ECB dropped a financial bomb on Greece, you can see as price has returned to the area, 3C is clearly diverging, a relative negative divegrence, in fact it's actually a leading negative divergence, but this is a good chart for the concept of relative divergences.

 The same for other Index futures and longer timeframes as well like ES 7 min

And TF 15 min.

As for the averages, mostly in line in the short term intraday 1-2 min charts, they didn't have much time to fall yesterday after the ECB action so they remain pretty much in the area...
 SPY 1 min intraday appears to be in line, but like the Index futures, the stronger 5 min charts in the averages look like this which is similar to the Index futures.

5 min SPY leading negative as have been all of the averages in the timeframe. Note the reversal process I had drawn in, sorry it's not a great drawing, but I think you get the idea of proportionality.

We'll see where things go from here and I'll have additional updates.

Is it just me or does anyone else feel like the EU is about to come apart at the seams?