Tuesday, April 28, 2015

A Visual

I didn't want my last post, Quick Market Update to come off sounding more uncertain than the market really is. I'd say that the near term uncertainty is on the level of something like today's move itself and not much beyond that, but the market is dynamic and until I see high probability, low risk, solid entries/trades based on objective information, it's my job to give you what I know and not to try to force anything, just be transparent about the market and you can use that in your analysis or disregard it.

As a visual of the charts so you have some idea and I didn't give you the wrong impression...

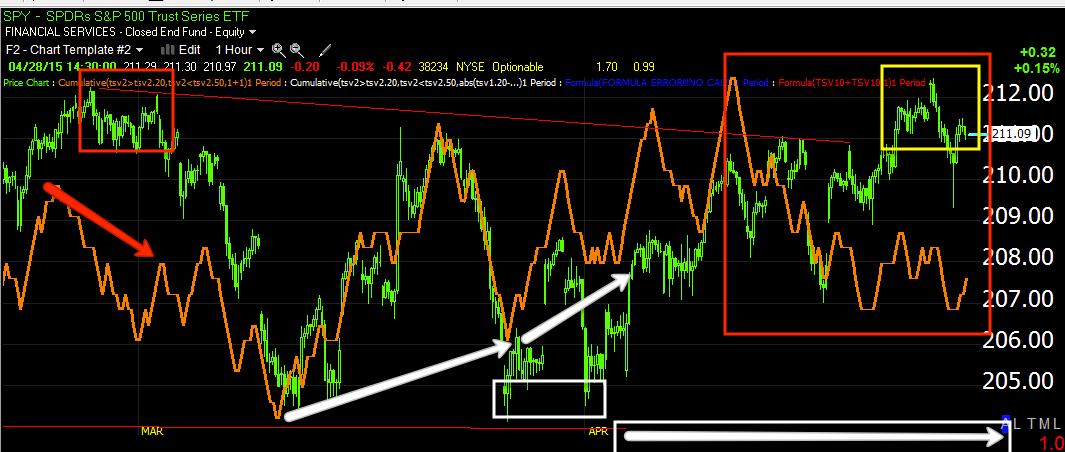
 SPY 60 min since the April 2nd positive divergence and now a deep leading negative divergence.

 QQQ 30 min through the same time frame and a leading negative divergence/distribution in to higher prices and the b/o head fake area.

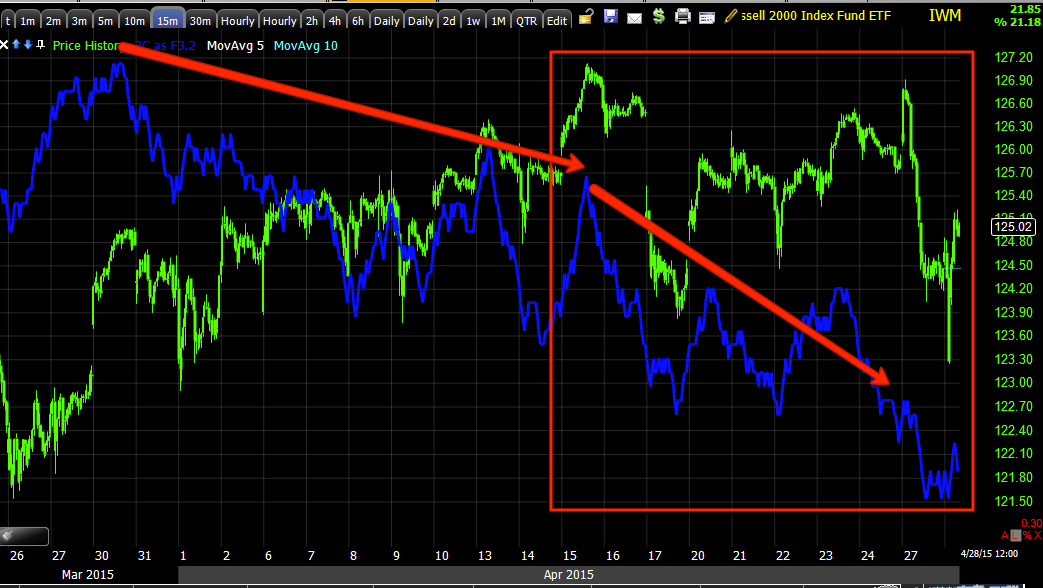
IWM 15 min with the same trend.

*These are the most important charts, the highest probability as they represent the largest flow of funds.

 QQQ 5 min leading negative in a stronger way at its breakout/head fake area, this is how we confirm a suspected head fake move, look for confirmation or a divergence.

 IWM 3 min doing the same as the trend develops

The SPY 2 min chart above is negative intraday as is its 3 min and 5 min, all similar to this.

However the "steering" timeframe of 1 min which represents the nearest term trade, but also the weakest, looks like this...
 That's not a negative divegrence and thus as a timing indication, although very weak and causing me little to no worry, is telling me the "ballet" has not aligned which is what I also saw in futures, although those may clear up overnight.

The Q's have a VERY different look, very ugly, but I have to consider futures as well...
 QQQ 1 min trend since the head fake breakout, you can't ask for better head fake confirmation or a false breakout.

What this means in practical terms for trade ideas...I love NFLX short, I consider it a core short position, I would take it here as a trend trade/core short, but I'm looking specifically for an options/Put position entry.

The long term daily chart shows the multiple stages of a cycle/trend from left to right showing a stage 3 top, then stage 4 decline, capitulation at "C" followed by a new stage 1 base and rounding bottom, then stage 2 mark-up in to a HUGE stage 3 top (Broadening Top) with a head fake move sitting just above, a near perfect equity short entry for a trend trade.

The charts agree...
 2 hour shows the accumulation before last earnings I suspected were to bail out market makers who had losses from a large previous gap down as they held inventory at the higher levels, thus the rally on horrible earnings as it was already put in to place well before earnings. Then our short at the exact top on Feb. 26th at #3, the next gap up earnings at 4 and a worsening leading negative divegrence with NO confirmation at all.

The 60 min chart confirming the same.

The 30 min chart confirming the same.

And the 5 min chart with clear details confirming the same, these are the highest probability/strongest signals, all negative.

However for an options trade, timing is key...
This 1 min intraday chart of NFLX is not giving me a strong signal to enter that put position, it's not giving much of a signal at all, thus I'd be making a decision based on opinion as far as timing rather than objective evidence.


Quick Market Update

I don't see near term action doing anything other than giving up today's gains.

There's a possibility of building support at this morning's intraday low, but as of now I HAVE NO EVIDENCE WHATSOEVER TO POINT TO THAT as the charts (intraday) are still negative, it's not like they are showing positive divergences in to lower prices intraday suggesting a base, but we also aren't in the area.

I suspect this has more to do with keeping the market fairly neutral "looking" ahead of the F_O_M_C tomorrow afternoon for whatever reason.

Remember, while not common, we have caught at least 2 F_O_M_C leaks in the past on the same day with very strong, unusual 3C signals that gave away the leak hours before hand.

The larger picture charts are all negative and show the highest probability is for all of this to end on the downside and that's not even including my next post.

However right now index futures are still mixed through the 7-15 min timeframes and they should all line up nice and neatly with the watchlist stocks when the market is ready, I can't imagine we are far from it in terms of the April run.

Our trades are entered on objective evidence and STRONG probabilities, we have a lot of strong strategic probabilities, it's the short term tactical entry that I'm waiting for and so far, it has been the right thing to do.

More to follow.

Oh and mom came out of surgery fine so far, haven't seen her yet, I understand it will be painful. Thank you for all the well wishes and emails!

Near Term Direction

After having gone through most of my watchlist assets, the thing I'm missing is that "beautiful ballet" of the market I described in this weekend's posts, Important Market Update Part 1: The Forecast and Important Market Update Part 2: The Forecast Plays Out & The Beauty of the Market. Granted, it's a very rare moment and one that can occur in a virtual flash in terms of the market, but despite market bounce strength today and the failure of that as expected on such a tight "W", I'm not seeing the watchlist assets/trade-set-ups all coming together.

You can see how we forecast the bounce yesterday and below you can see the weakness developing in to today...

 TICK intraday has been stronger on the whole, but is starting to deteriorate a bit now which fits with the intraday 3C charts as seen below and from recent posts...

IWM 1 min leading negative

 QQQ 1 min leading negative

QQQ 30 min triangle and breakout with a negative divegrence at what we expected to be a head fake, so far good confirmation of exactly that.

SPY 60 min and breakout from the triangle, once again good confirmation of the triangle breakout being a head fake move as there's 3C distribution in to it on a strong 60 min chart (note the accumulation area, the exact same area I have been showing over and over.

In addition, the intraday Index futures charts have been going negative just like the averages, foreshadowing the market/price action intraday.

However, remember what 1 of the 3 final conditions was, the 7, 10 and 15 min Index futures charts all negative. They are all over the place in those timeframes, some positive which was from yesterday, a continuation of strength for today's "V" shape reversal, some negative, some in line, but not that ballet that is unmistakable, which is why I have not been throwing trade ideas out there today.

I'll continue to monitor the situation and update you as soon as I know more. The overall trend as seen on the 30/60 min charts above are right in line with expectations, the forecast and what we expect next (a larger leg down), however right now, it seems maybe they're trying to keep the market as close to neutral until the F_O_M_C.

Leading Indicators & Market Update

Interestingly, not only did 3C forecast a near term bounce yesterday, but the Dominant Price/Volume Relationship from yesterday's Daily Wrap...

"The dominant price / volume relationship came in at Dow 14 stocks, NDX 51,  R2K 952, SPX 218. This is a dominant price/volume relationship which came in at Close Down/Volume Up. 

This relationship is a short term oversold condition, not the kind of oversold that is represented by indicators such as RSI, but much more accurate based on market breadth. 

The most common bias is for a next day close higher, in line with our 3C short term indications."


In addition, Yields were also leading toward the close which I demonstrated using TLT as the bond market closes at 3 p.m., again from the Daily Wrap

 This is yesterday's TLT chart posted (inverted in red) vs the SPX. Note the leading positive position of yields in to the close yesterday.

Yields today are supportive, remember they tend to attract equities like a magnet , but also remember this is only intraday, the longer term posted the last several nights shows an extremely negative situation.
 5 year yields intraday in perfect correlation with the SPX.

This is 5 year yields leading the market lower in to the highs and then  a "SLIGHT" positive indication for near term market support (the bounce we forecasted yesterday-very short term) which is off this morning's "V" bottom.

Interestingly, it looks like this move had VERY LITTLE TO DO WITH IRAN. First of all we had indications in 3C, yields, internals, etc. 

At #1 is the VIX's reaction to news that Iran had captured a US flagged ship. However at #2, almost 45 minutes before it was made clear it wasn't a US ship, someone was already slamming the VIX (common to see when they are trying to ramp the market). At #3 we find out the ship was not US.

Our custom SPX:RUT Ratio was also positive as of yesterday afternoon and then more in to this morning's "V" lows and in line since, of course the long term outlook of this indicator is very negative for the market.

It's just interesting how many little levers and indications pointed to this bounce off yesterday's ugliness.

 It's not all strawberries though. Our Leading Indicator Pro Sentiment is NOT buying the move today which is in line with my assumption this is a weak, "V" based move that won't hold much for long, a fitting move at this moment in the process since the April 2nd forecast.

HY Credit is also NOT buying the move.

As to the averages... intraday weakness is setting in which should have been expected off a "V" base.

 SPY 2 min

QQQ 1 min

QQQ 3 min

IWM 1 min

IWM 5 min.

I have some watchlists to go through.

Quick Market Update

Internals/3C underlying signals are slipping, we should see some weakness intraday developing and overall.

Market Update

I'm still here, still keeping my eye on the market.

This was the intraday flameout I mentioned to look for earlier...
 QQQ 30 min with a bullish hammer on higher volume.

I don't usually subscribe to "V" reversals, but in this case, I think that may be all we get which would be fitting for a reversal of a head fake move on the April Triangle breakout.

Note the improvement in the NYSE TICK Index today.

IWM 3 min positive

IWM 5 min positive, but that's about as far as we go. The fact that this is such a narrow "V" reversal makes the divergences less important as there's less base to sup[port a move. I'd almost think of this as something like a blow-off move, at least in internals , underlying strength, etc. Please don't confuse this with a forecast of a blow-off top beyond what is already in place, I'm just saying the internal and underlying strength associated with the "V" reversal is similar to the underlying strength in such a move-weak.

IWM 15 min trend is the clear , high probability outcome as the entire April move has seen distribution in to it. We have seen even more intense divergences this week so far (and since Friday in QQQ).

QQQ 2 min intraday looks impressive...

 QQQ 5 min is showing the clear weakness since the head fake move in the Q's.

QQQ 30 min

SPY 1 min positive for a bounce as expected...

3 min SPY positive.

SPY goes out to 5 mins, but again, without anything beyond a "V" base, I just don't see this offering much support on the upside for very long.

more to come...

Market Update

Thank you again for all of the fantastic emails, I wish I could respond to each and thank you, but I don't think I'd get much done today. We are still in pre-op so I keep moving from place to place, but I have had my eye on the market and by 11:30, I'll be watching the market the entire day.

I still have little doubt we'll get our bounce, you know what to look for...
 A bullish candlestick on an intraday timeframe with increased volume like this SPY 10-min chart this morning.

I don't believe in "V" bottoms, so look for a second low, that may make for a nice, quick Call option play.

 The positive divergences are still in effect, SPY 1 min at this morning's lows.

Here's the 2 min chart still positive.

And the 3 min chart.

IWM 5 min.

TICK improving...

On a funny note, we were just sitting with her in pre-op and a flood of water came down from the ceiling , literally approaching us at a rate of about 1 foot per 2 seconds and had to evacuate to another pre-op room, however my mother who has been unable to drink since midnight was doing her best to roll off the stretcher and lap up the water.

A.M. Update

Good morning and thank you for the well-wishes, thoughts and prayers, they are much appreciated.

The global markets are quite mixed with multiple events.

Starting in Japan, Retail Sales printed at -9.7% Y/Y which is the largest annual decline in their history. Consensus was for a drop of -7.3% which took in to consideration March demand in front of April tax hikes.

The PBoC's chief economist came out clearly and denied yesterday's unsourced rumors that China may consider QE, also noting that it is illegal under their Central Bank laws to specifically finance government.

In Greece local municipalities are refusing to hand over their money to the Greek Central Bank which is $400 mn short still for the end of month payment of salaries and pensions and still another $1bn short for May IMF payments. This has sent PM Alex Tsipras scrambling to change his tone and rush through a bevy of new "TROIKA" demanded laws in an effort to secure financing. If I understood the details, a preliminary agreement could be reached Mat 9th which would be too late for initial disbursements to cover the end of month salaries/pensions as well as the first of 2 IMF May payments. Furthermore Germany has said the deal must be comprehensive, not piece meal so Tsipras has thrown Fin Min Varoufakis under the bus and turned his back on all campaign pledges as Greece slides in to insolvency.

US futures are mostly a bit lower and mixed, however our view that we would see a market bounce today was strengthened overnight when the 1 min positive divergences in futures turned in to (migrated) to 5 min positive divergence, which makes it quite likely we bounce off yesterday's lows. This is good as there were a number of assets that looked as they would bounce a bit like Transports, Biotechs, etc. This gives us something to set up trades in to so far as the majority of watch list stocks as of yesterday.

 ES 5 min

NQ 5 min

TF 5 min

So I believe our analysis from yesterday afternoon is on track, this does include the significant damage done to the market as well, but this entire move has been remarkably well timed with the F_O_M_C meeting which begins today and ends at 2 p.m. tomorrow with the policy statement and no press conference. Remember my warning every time, "BEWARE THE F_E_D KNEE JERK REACTION" it is almost always wrong and almost always retraced within a few days to weeks, sometimes even hours.

Somehow I suspect the end of this move will tie in to tomorrow's F_O_M_C, but we'll let the market tell us that.

I'm off now to take my mother to the hospital and will be online and working by the open. I'll see you soon.