Monday, June 8, 2015

Transports Update

I'm covering Transports more out of the dreaded "Hope" word than anything. We've already had two opportunities to open core/trend short positions in transports and they are at gains, however Transports are one of my favorite short trades out there so for those who may not have gotten in and would like to, I've been hoping the 30/60 min positive divergence in transports would be enough to give us a decent enough bounce that we can open new or add-to short positions in to price strength/underlying weakness before its too late.

From a Dow Theory perspective as I've shown several times, Transports are flashing bright red lights with regard to the market.

 Industrials (green) vs. Transports (blue) and the difference between their performance on a custom histogram I created (red). You likely remember when transports were a momentum group and popular, outperforming the Dow below (red histogram above the zero line), and of course the Dow-Confirmation problem between Industrials and Transports as the latter has deteriorated significantly (now below the zero line).

Still, I'm not looking for a reversal in transports that ends this divergence between the two, just hoping for enough of a bounce to reduce risk and make an entry worthwhile.

The 30 min (above) and 60 min IYT/Dow-20 charts have shown a positive divergence that is large enough that a year ago it would have supported a 2 week rally before Transports even began to lose momentum,  now they can hardly move above their bounce base.

 The 15 min chart which is VERY close to migrating to the 30 min and turning it south, has already seen quite a bit of distribution n to price gains to the upside, note the leading negative divergence already sending Transports lower.

 And the same is seen on the 5 min chart with the base/accumulation area to the left.

This does not look good for transports, it looks great for our established short positions there, but still I'd love to get one more crack at them.

The intraday chart (1 min) like the major averages isn't all that impressive at all. As I said Friday, if the market is going to get ANY upside, it has some work to do early this week. Again, this is not anything I'd be very excited about as far as prospects for a bounce, but the 30/60 min charts, while damaged, are still intact so there's still a chance until they are as badly damaged as the 15 min chart above which is moving their way.

Taking a closer look intraday on the same 1 min chart, there has been more of a lateral trend than the early downtrend and there's an intraday positive forming just as we have seen in some of the averages. It looks to me it has quite a bit of work to do for a decent bounce to be reality, but it is possible and as the morning games burn off, both the averages and Transports are seeing better looking charts intraday, still FAR from anything resembling good, but they look like they are trying to do that work I mentioned in Friday's The Week Ahead post.

So we'll be patient, see how much work they do and if it will be enough. If you are interested in Transports as a trade, I would only trade it from the short side by letting price come to you, therefore I'd set some alerts above current price levels. I have set alerts and will update you if it looks like there's going to be an opportunity to get in to this position. I personally don't believe trading a bounce in Transports is worth the risk, even with better looking charts than what we have now, but we'll keep tabs on the progression.


Early Update

As expected Friday in the The Week Ahead post, the market isn't going anywhere on the upside without some work being done first. We are not down so much this morning that I would be looking for an intraday short term capitulation (selling event) that could lead to a bounce or even lateral movement to build some room for a bounce, although it is early.

TICK is as you might expect for price action this morning...

 We have a >-1000 reading this morning and slightly better than +500, there are no surprises here, nothing immediately suggesting an intraday flameout on the downside.

 The SPY 2 min intraday chart as shown last week is nearly perfectly in line with the downside and confirmation. There are some very short term charts that "could" provide a base for a bounce,  that work I said I thought would need to be done early this week if the market were going to see any upside.
For instance, the 1 min QQQ has what looks as if it could be an intraday positive divergence, but 3C needs to pivot up and lock it in, otherwise it's likely just to follow price lower, but this could be an early hint of that "work" that needs to be done, starting to happen. We'll know shortly.

However put the same chart in context on a slightly longer timeframe and you see it's really not much right now even if it does lock in.


And the long term charts or the charts of highest probability resolution are CLEARLY negative as they have been...
 SPY 60 min.

I do think the market "can" do the work, enough to get a bounce out of it, but as of now it has not and we've always known the probabilities were highly skewed to the downside, still it would be nice to get some additional positions in place and for that, for the most part with some exceptions, we need some kind of brief market price strength, although that would be all it is.

 Remember I said to keep this post, What High Yield credit is Screaming, in mind when considering any other analysis , either short term or longer term. You also know HYG is one of the first levers they'll reach for when trying to support the market. That being the case an HYG update seemed reasonable here as well, but again don't forget the post linked just above on HY Credit.
 This is HYG 15 min which is in line with the downtrend as it should be.

And HYG 60 min, much stronger and much uglier with downside confirmation, however...

HYG 1 min on the second day of a positive divergence. It seems someone is trying to give the market some footing, but again recall that even though this may look like an impressive divergence, it's only a 1 min intraday chart vs the very strong 15 and 60 min negatives above, however it "may" be enough to let the market find some temporary footing here soon.

I suspect we'd need to see an intraday capitulation event so keep an eye out for that too, look for large volume on a downside selling event.

I'll keep you updated.

A.M. Update

Good morning,
I hope everyone had an enjoyable weekend.

It seems the markets haven't been too terribly exciting with most markets apparently taking their cue from the US on Friday. However there was a story (or leak) on President Obama talking about a strong USD is bad, which was promptly refuted in the overnight session by a uS "official". The damage seems to have been done, although I think this has nothing to do with the $USD movement as we were calling for the end of its counter trend bounce , also called a very short term bounce which we saw Friday and called for the end of that too and that's where we are.
 60 min $USD chart with the large prevailing downtrend and then the counter trend bounce (yellow) followed by the end of the bounce and down trend resumption with a day's worth of strength called last week (Thursday) and that now ending and back to the former downtrend.

 Here on a 1 min overnight chart you can see the Obama leak with the $USD dropping and the "official" denial with a little recovery, but it has rolled back over since then which has been our forecast , Obama or not.

 This 3 min chart shows the negative divergence in to Friday's parabolic push higher on Payrolls.


 We opened a VERY short term, very speculative USO call/long position on Friday, this 5 min Crude futures (CL) chart still looks like it will see a little bounce and then I expect it to continue to pullback...

This is a longer 15 min crude chart and the nature of the very short term corrective move to the upside from Friday's Trade Idea: USO (Speculative)

 Gold has some work to do, but it looks like futures are getting started on it as the gold futures 15 min chart shows. I'd personally wait a bit though and let it do its work.

And TLT/US treasuries are looking like they are getting closer to what I believe will be a counter trend bounce, there was news overnight on the DOJ opening a probe in to Treasury market manipulation.

I'll be looking for the new TLT long entry.

And ES/SPX futures 1 min as I said Friday, if they are going to gain some traction or the market, they have some work to do basing and getting their act together.

We'll see what the cash market charts look like shortly, I'm not expecting any big surprises on the open. If I had to guess, I'd say some very early price strength followed by a retracement of that again early in the a.m. session.

Friday, June 5, 2015

Looking Back to the Accuracy of Our Concepts & Looking Forward: TLT

*I know there's quite a bit of reading here, but even if you are not interested in TLT in the least, the concepts we use can be applied to ANY asset, any stock, and in any timeframe from a day trader to a long term investor. I would encourage you to make time to read the following if you want to better understand our concepts that are proven as you'll see and start applying the very same concepts to your trading.*


I had to go back a ways and look through a lot of posts to find all of this, but I think when you are talking about concepts that we have come to rely on, it's worth the time to go back to when they were throwing red flags and show exactly what those were, you'll see they are the same concepts we use every day today.

Last year (2014) treasuries significantly outperformed equities, TLT +23.25% on the year vs the SPX at +12.39% on the year. 

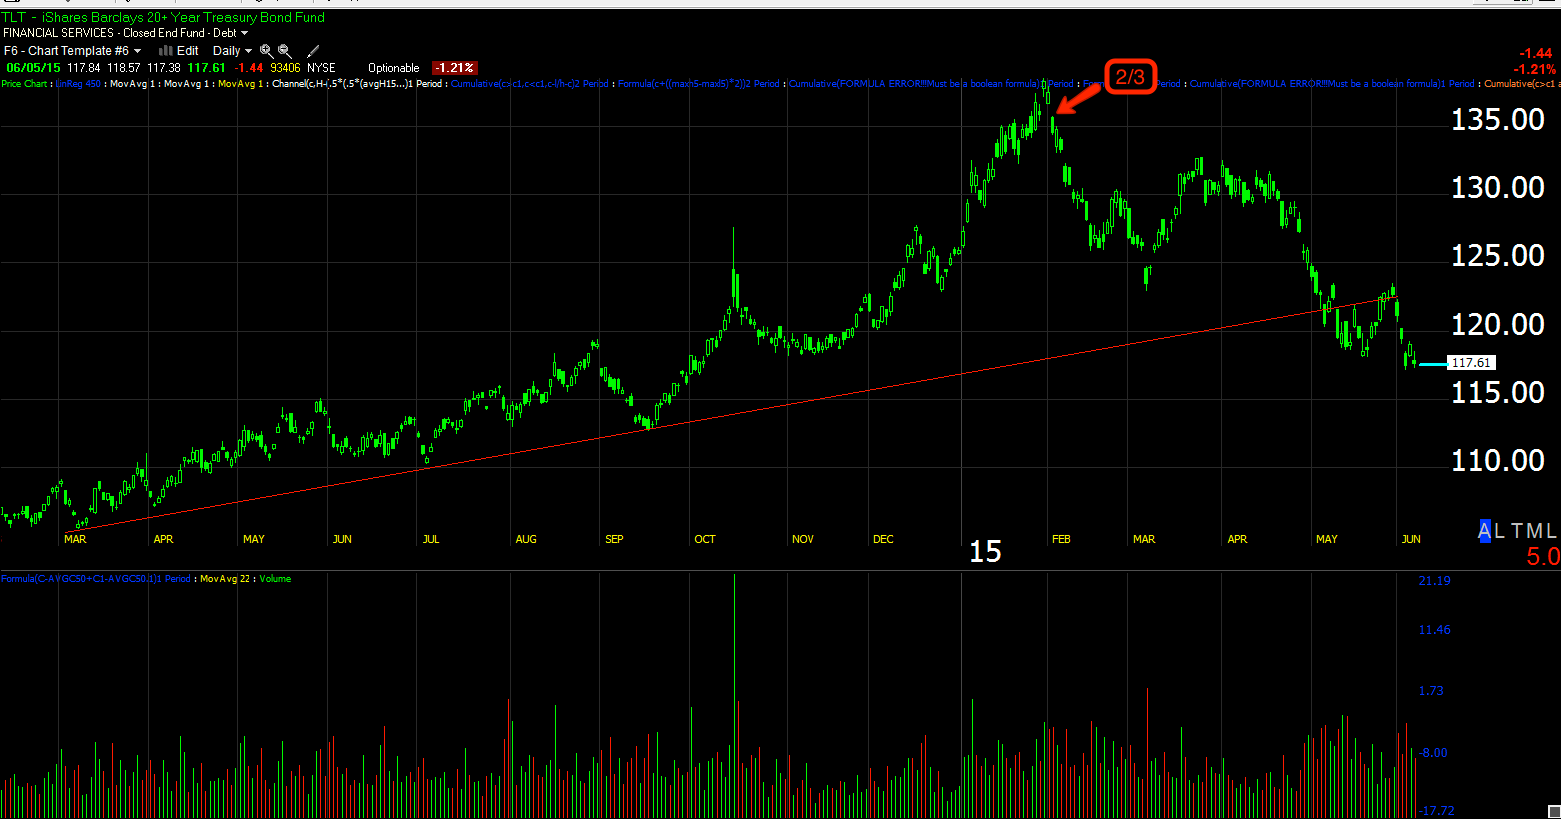
We had a lot of solid TLT (20+ year Treasury) long trades, however the charts below come from a post from February 3rd, 2015 which would have looked like this...

If you can see it close enough, it's less than 3% off the all time highs, so I'd call the expectants and charts from the post below, "Timely".

I'm picking out the excepts from this post from Feb 3rd 2015, Treasury Futures/ TLT Update because it is long and deals with things like duration which are not necessarily relevant to the points ahead, although feel free to read it if you like. In looking back to the F_O_M_C meeting that had just occurred and the top in the $USD shortly after, it seems very clear to me that smart money knew as far back as January when the probable start in interest rate hikes would be and started moving quickly considering the sizes of their positions. Pay attention to the details below and you'll see that not only does this seem to tell us smart money ones a lot more than we are being led to believe right now, but some of the things happening at the time (remember we were only 3-days off the all time high in TLT when this was posted) are a reflection of smart money closing the carry trade; one of the first signals of such is a fall in bond prices. You'll also note things like CNBC calling bonds a buy as they had already topped..coincidence? Below the larger italic text from the Feb. 3rd post, I'll pick up on the current TLT charts.

*Bold lettering added by me now for emphasis*

"Since our last trade idea in TLT (2x levered long via shorting TBT) which made a decent gain (and treasuries overall outperformed stocks last year with an 11% gain), I've seen something that caused me to close out the idea, something TLT hasn't shown for a while.

In 2014 bonds outperformed equities, +11% on the year. However things are obviously changing....

First lets look at TLT because it is exhibiting not only 3C red flags, but price action red flags as well.

 These are the 4 stages on the daily TLT (20+ year bond fund) chart from left to right, stage 3 top to stage 4 decline to stage 1 base, stage 2 mark-up and note the trend line during 2014 and the increased ROC (Rate of Change) in to 2015... Look familiar?

I often say that this , "bullish looking" price action is a "Red Flag" warning of a trend change to come. Increased price volatility is a feature we often see just between changes of trends or stages, it's what creates the Channel Buster.

This daily chart alone with a near parabolic daily chart in TLT is enough for me to back off the position.
The long term 60 min chart in TLT for the longest time has been in line or price confirmation, the most recent divegrence is a relative negative on a long timeframe of 60 mins. The white box and arrow is where we entered the last TLT long (2x long via shorting TBT to create the leverage) which was recently closed out because of the 3C charts, but not this one.

At the 30 min chart, note the area of our last long trade entry and the area of increased ROC in price as well as the 3C chart that goes with that area of increased ROC, everything fits and is screaming distribution/Top in TLT. The CNBC commentator's idea to go long TLT is at best a scary one.

 This is the 15 min chart showing the positive divegrence at the rounding bottom where we entered our last TLT long position, again the increased ROC area of price has a large leading negative divegrence, so it's not only a warning of a red flag in price movement, but on the 3C charts as a form of confirmation.


Treasury Futures, ZB=30 year, ZN= 10 year, ZF= 5 year and ZT=2 year...

First the 30 min charts...
 30 year T's (with the F_O_M_C highlighted on the time axis in the red box), is leading negative since just after the F_O_M_C, perhaps the policy statement was taken more hawkishly than some are willing to admit and of course smart money is always going to try to sell in to strength, not only because it makes sense, but because of the size of their positions, they need strength, demand/volume.
 The 10 year T Futures looks nearly as bad.

Once again, let me remind you that this was not "Monday morning quarterbacking" or after the fact, this is what TLT looked like on the close the day this was posted...

TLT on Feb. 3rd 2015 when the post above and the warning signs were disclosed. And TLT today...

Again, the Feb 3rd post was 2-days off the all time high in TLT with a nearly 13% decline since then.

The concepts and signals that were written about then are the same ones we use everyday, we just happen to have the benefit of hindsight now.

I would recommend reading the next post which deals with the "Channel Buster" concept and why TLT or "How" should see its power to make a strong counter trend rally. If the $USD's recent projected counter trend rally is anything to judge by, the TLT move, once confirmed should make a stronger upside move than we have seen at any point in TLT's past. 

Since I've already written at length about the Channel Buster concept and how that fuels a strong reversal move, I'll just link to the post, Bond Rally / Swing. This is the overall trade set-up, 3C charts at this point just help us confirm and identify timing for entries.

I am not claiming that Treasuries should see a true reversal back to the upside, I believe they are setting up for a counter trend rally which are some of the strongest rallies you can see in any market whether bull or bear.

As for TLT's current charts moving forward, where we are and what we might look for...

 The TLT 1 min leading positive chart,  but there's a certain price range they will not buy above.

I know it can be hard to remain patient when you see the possibilities of a great race and the chances it may slip right by you, but I believe patience has given me the chance to be able to survive long enough to let some of those great trades become profitable rather than entering them, getting bumped from them and then watching them take off.

 The 3 min TLT chart/accumulation, but note the direction of 3C in to the afternoon, it should be leading to the upside when we are ready and that "could" happen in an hour.

 Again the 5 min chart shows the same accumulation and turn down, it seems there's a lower range here in which they are willing to buy; I'd say at this point it doesn't extend beyond $119.


On this larger 10 min chart showing what will likely be a double-bottom shaped base, the buying seems to stop in the $122-$122.40 area and they send prices lower again.
When the leading positive divergence at the section labelled "A" shows up in like manner or stronger at the section labelled "B", I would say the 3C charts will be screaming and that's a trade I don't ignore, but until then, I trust in confirmation and strong signals. If I miss the trade, just like $USD made a huge move a week ago, They'll be another.


TLT is Getting Very Close To A Long

I have been seriously considering adding to TLT at least in a speculative way with options, but this needs to be the best timed of all the trades we can enter.

The futures charts are also looking very good from intraday 1 min charts out to about the intermediate term, however I think if this is going to be the counter trend rally we are expecting, there are a few more timeframes it needs to add.

I wouldn't be opposed to TLT long equity partial position, I've already opened one.

As far as options, I suspect that we are very close, but very close and right there are a big difference with options that aren't that much of a problem with an equity or 2x leveraged long (I shorted TBT to create a 2x long TLT position several weeks back). I'd be open to that if I hadn't already opened that partial position.

Take a look at it, I'll have charts up soon and tell you again why the trade makes sense.

The Week Ahead

It has been a tough week for signals, although they started to improve late yesterday and I suspect that's because the Greek default that was set for today was all bundled up with the rest of their June IMF payments and instead of $300 mn Euros due today which they don't have, it will be $1.5 bn Euros at the end of the month which they don't have, but it bought them some time so the F_O_M_C on the 16th and 17th will be the next big event.

In the mean time, I suspect signals will continue to get better now that everyone's not standing on the sideline waiting to see if Greece defaults today.

I did consider opening a hedging VXX put for the VXX and UVXY longer term trend long positions, but I can't find enough decent evidence on the charts to justify it. There are some charts, especially futures that point towarrd the kind of bounce I thought we'd get this week, the kind of bounce that fulfills last week's The Week Ahead, but again there's very little evidence for that either unless the market does some serious work next week.

In all the charts you consider, you have to consider the What High Yield credit is Screaming post.

So far, there's not much at all that even looks as decent as yesterday, for example...

 SPY 1 min intraday looks worse than yesterday. This does NOT look like it can support much if any bounce in to next week, so as I said, unless there's some additional short term base work put in, this market is looking dangerously close the the edge of the cliff.

 This SPY 3 min chart reduces some of the noise and gives a bit better look at the trend, still there's barstool anything there to support a bounce at all.

 Put the same chart in context of its trend and you can see how minor that chart is.

 Not to mention the larger trends like 10 min charts that are just getting worse and worse.

 Or clean up the noise and the entire year of 2015 shows the trend of 3C really falling off a cliff.

I was hoping we'd get in to some of those shorts before then.

The QQQ / IWM aren't any better.
 QQQ 1 min is about the best it gets at this point which is not very good.

 Compared to the larger 10 min trend and a much stronger chart, I'm sure you are getting the drift.

 The IWM intraday charts look like this, if anything I'd expect early weakness early next week as there's no confirmation at all here and it's not just this 1 chart.

 This is a 2 min chart just to prove it. As for the trend that has been developing, IWM 2 min shows even the confirmed downtrend to the far left looks better than the charts right now.

 And the larger 15 min trend, well that has been bad, it's when the short term timing harts start falling apart that you need to be concerned (you're long).

 Meanwhile the VXX trends in the same timeframe are strong, 10 min leading positive and further out.

As for the watch list stocks, I've been going through them all day and interestingly they don't seem to be waiting for the market for their set ups like the NFLX one posted Wednesday, NFLX Trade Set-Up 
 NFLX is doing what we need it to do without the market.

So far it is in line and needs to break a bit higher. However others like Transports probably don't have much left...

The Transports 60 min bounce that a year ago would have gone on for weeks and strongly...

It's starting to fade, although I think we can still get a better position a bit higher before it ends.

Again, unless there's some MAJOR work done early in the week, I think we'll be just taking what we can from the watch list of assets that are setting up on their own with no market support.

It's really not these charts that are as bad as they look, it's the HY Credit that's really screaming Bloody Murder for this market.