Wednesday, July 29, 2015

Dovish F_E_D-Inflation Concerns

This has been the main sticking point we've seen this year impeding the F_E_D from a rate hike, low inflation. They've even reduced the bar as I mentioned yesterday to not actually needing inflation to begin hiking, but "Feeling" comfortable that inflation is on target to move to their long-run average of 2%.

So even with built in work-arounds, inflation still remains stubbornly low which is what I was concerned with near term for Gold as gold is typically bought on inflation concerns, before actual inflation.

In any case, something is bothering me about the market here, it feels like churning and we can burn through the "gas" in those charts pretty quick if we are churning.

I used the closest timeframe to the market reaction since the F_O_M_C on the SPY- 15 min and to me it looks a lot like churning.

 Although this is a pretty common initial reaction, it can certainly facilitate churning, the handing off of shares from strong hands to weak hands.

I decided after going through the charts, I'm going to look for the best exit for the IWM call position and then I may enter a new short position or perhaps a long VXX / Call position.

Speaking of which, there's a divergence between XIV which is the inverse of VXX (short term VIX futures) and VXX...
 XIV above should look better than it does.

The 1 min SPY tells me it's probable that I can get some more juice out of the market on the upside, but I don't think that the trend of the last 2-days has abated, that is steady distribution in to higher prices.

 Beyond that looking at the larger trend of just what I described above, the SPY 5 min chart is a perfect example.

as for Futures reaction...

 ES intraday 1 min did not react well to the F_O_M_C as it's in leading negative position intraday.

 The Russell 2000 futures have been in negative position all day, the point is at the F_O_M_C there was no positive change in their reaction.

The $USDX has a negative intraday divergence and...

The Yen has a positive intraday divergence,  this means I don't trust the USD/JPY to hold steady on any upside, which wouldn't be surprising as it has been carrying a negative divergence intraday, it's just the $USDX and Yen didn't have any solid confirmation earlier.

And that ES 5 min chart, the prerequisite to any trade, for instance for a short SPY trade the 5 min ES chart must be negative (my own rules), is seeing a wider divergence than this morning.

As to some of the other averages, I'm looking for upside to exit the IWM calls at a gain which they are now at...
 However this is a close in view of the IWM intraday, it's not exactly screaming positive here.

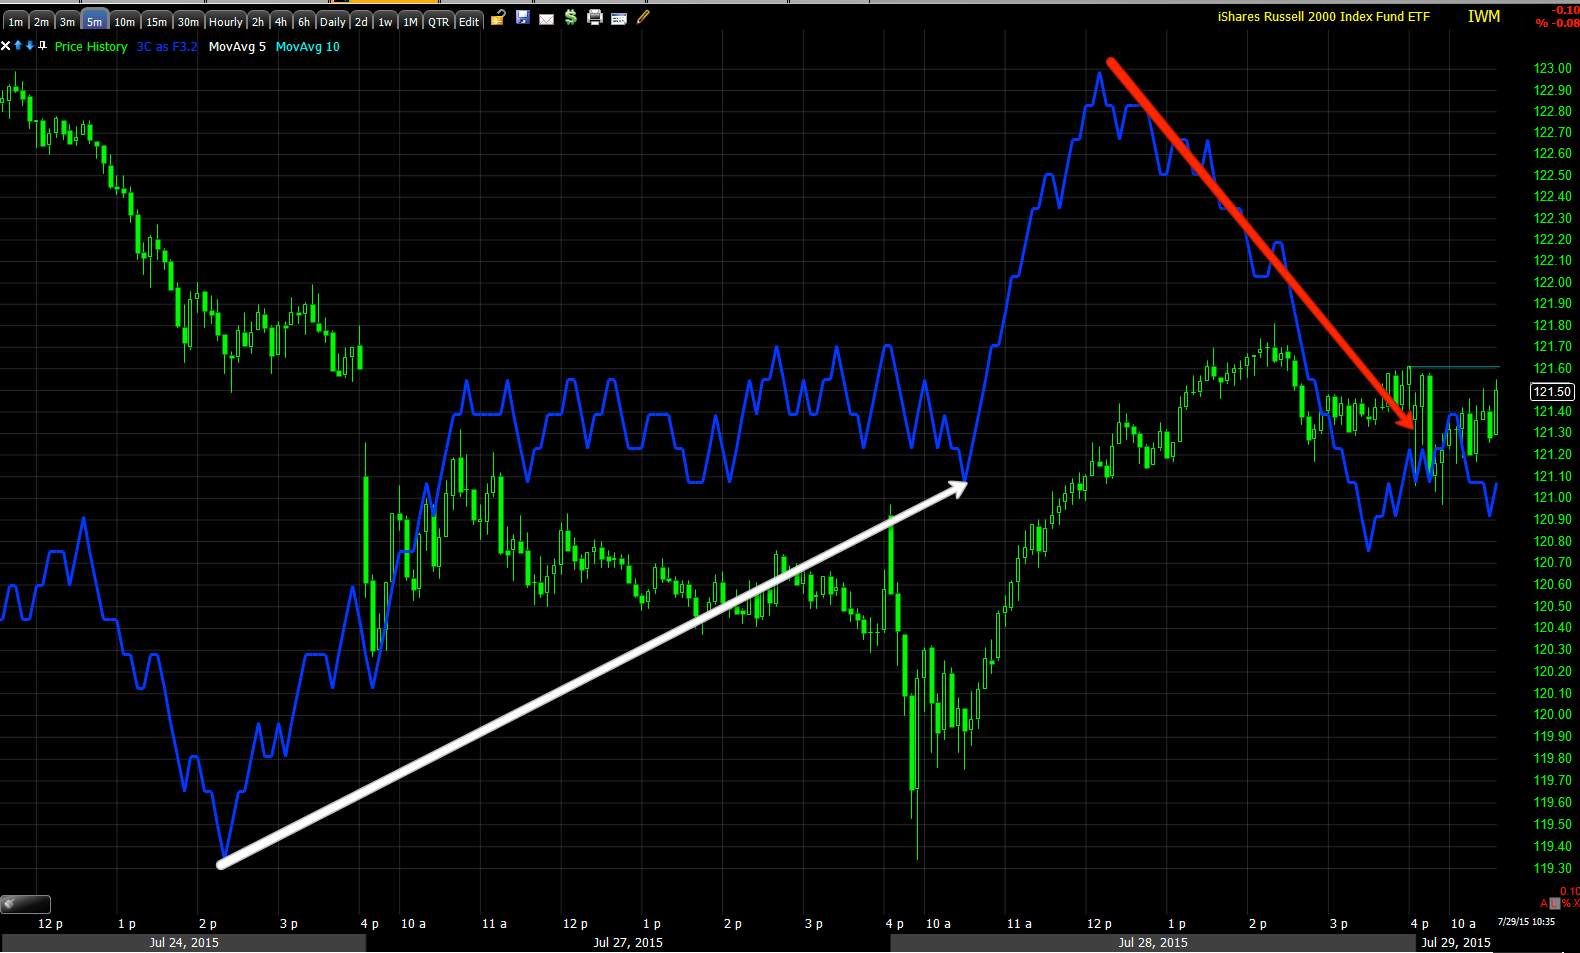
 IWM 5 min negative like other assets in the same timeframe and the long version (100 period) stochastic I use to define a trend, looks like it's very close to making a decisive slip below the 75/80 level which is where I consider the up trend/bounce to be weakening dangerously.

And finally IWM 10 min still in an ugly place as the process of migration of the divergence has reached these longer term charts that were flying positive yesterday.

Again, my plan is to look for the best exit for the IWM calls, then I'll likely look at some assets that I now have good overall charts for a new position like VXX calls as I already put out ad have an open UVXY long trade idea.


Futures and LeadingIndicators Update

It's not unusual for there to be a pretty dull market in front of the F_O_M_C and then a knee jerk reaction and then what the market really thinks.

However that extra bit of help I hoped to find in Leading Indicators and Futures including VIX, Index, currency, gold, oil, etc was not there. In fact they all left me with the exact same impression the charts of the major averages did, THERE'S STILL GAs in the tank on this bounce, although it is being steadily eroded, it doesn't look like it's there yet.

Of course the F_E_D could change that pretty quickly, but I'd expect to see smart money take off all of the Gas in the tank positions before the F_O_M_C, it doesn't appear they have.

For now, unless something changes dramatically between now and 2 pm, I'm going to leave all positions in place which includes core shorts and the short term bounce IWM calls.

One interesting thing I did see across futures for the 3rd day in a row is very consistent positive signals in Crude oil futures so I suspect we are going to be seeing more upside there.


Market Update

As you probably recall from Friday's Week Ahead forecast, one of two scenarios (both were bounces in the early part of the week) was that the market put together the base it needed for a short term bounce which is pretty darn normal at the 200-day SPX support after 5 days of red closes.

The IWM call position was added to this week and is sitting pretty close to breakeven, but I'm getting a bit more impatient with the market and may be looking to close the position sooner than later. This is not based on anything especially new, it's based on the process of distribution I chronicled earlier today.

Thus far, although I'd completely expect traders to look to hedge positions in front of an unknown event such as the 2 p.m. F_O_M_C, I have to say the VXX / UVXY long positions and their respective charts are looking exceptionally strong (UVXY long idea was left open despite knowing the probability of a bounce as well as all core/trend shorts).

I'm seeing what looks like more deterioration, I would't call it SCREAMING as of this moment, but it's a pretty persistent trend and I don't have a lot of confidence that the Gas in the Tank charts can hold out through the entire day even if it weren't a F_E_D /  F_O_M_C day.

Right after this post I'm going to look at Leading Indicators and Futures as quickly as I can and make some decisions going in to the F_O_M_C, but for now here's a sample of the charts...

 SPY 1 min leading negative divergence.

 SPY 3 min leading negative in to today

 Damage moving to the SPY 5 min chart today

 For context, the SPY  15 min "Gas in the tank" chart.

 QQQ 2 min damage in to today.

QQQ 3 min negative. Like I said, it's not screaming or jumping off the chart with urgency, but it is persistent.

IWM 2 min intraday leading neg.

 IWM 5 min

This is a different perspective of the same IWM 5 min chart with a closer zoom to compare today's signals to yesterday's.

 IWM 10 min which you could do the same thing with as I did above with the 5 min chart, so it's some pretty significant movement.

HYG which was used earlier as support for the market is seeing intraday negatives in to higher prices as well, although I suspect it could still support the market in a pinch.

The NYSE intraday TICK.

And our custom indicator since the capitulation lows at "a", the second part of the base with improvement in breadth at "b"  and you can see today's breadth falling off.

Here's a closer look.

The custom TICK indicator with market breadth from very strong yesterday to deterioration today.

I'll get back to you on Leading Indicators and hopefully a review of Futures.

USO Update

Our last update for USO/Crude yesterday was, USO/Oil quick Update which the gist of was,

"This doesn't look like a wide enough base for a true upside trend reversal, but it may be the first rally/bounce in forming a larger "W" type base area."

As for today's update, something looks pretty interesting about USO and I'm leaving the 8/21 USO $17 call position for the time being.
This morning's EIA Crude Inventories saw a draw of -4.2 mn bbl while gasoline demand and refinery operating capacity remained very strong, about 6.2% higher than normal for this time of year.


The charts....

 Starting from a 5min chart this looks like a larger accumulation area, although a bit tepid at first.

 We want to see divergences strengthen and that means migrating to longer term charts which is what we have here on this 15 min USO chart which moved from in line to a leading positive divergence with a lot of it coming in yesterday.

The 30 min chart is showing essentially the same thing, but what's important here is that the divergence has migrated as far out as a 30 min chart in a fairly short period of time.

 Intraday (1 min) we saw a pop in USO and what looks like a consolidation/pullback intraday.

The 2 min chart is still in line intraday which if it stays that way, we are more likely looking at an intraday consolidation of today's gains.

On a daily chart you can see the Star and increased volume which looks like a short term capitulation/selling event which is not surprising given the way the charts above look.

As I said yesterday, although we are in the area (16-ish) that I expect oil will be able to put in a longer term/larger base for a true primary trend reversal (we'll get to that bridge when we cross it), I suspect we may be seeing the first bounce higher that forms a "W" type bottom. It looks to me like there's probably more room to go and especially over the next week or so which is why I'm leaving the USO 8/21 call trade idea open for now.

I'd consider taking a look at USO if you haven't already on any intraday pullback. I'll set some alerts in case we get one.

Gas in the Tank

Meaning there's still a divergence on a longer timeframe that is essentially the Maginot line for the market. Yesterday morning's early and steep slide was aggressively accumulated as there was plenty of supply (judging by volume), this is more or less what created the second half of the small "W" base the market bounced off and created the "Gas in the Tank" charts.

First the "Gas in the Tank" charts. Until these have serious divergences in them, they still have the power to support this bounce. Most of them formed within about an hour as a lot of shares became available yesterday morning on the initial nasty downside move. While the reverse process is usually just that, these charts "could" turn just as quickly, but we should see pretty solid evidence of that. However, just as we have seen with every bounce since the May head fake failed breakout attempt, any price strength has been sold in to.

 DIA's 10 min chart is where it has the most support.

The IWM 10 min chart which made quite a move within a single day for a longer intraday timeframe.

 QQQ 15 min which is a solid timeframe that usually can support a swing move, however the base is a bit small for much more than a 2-day move in my opinion.

 SPY 15 min which picked up a lot of shares Monday afternoon and Tuesday morning,

Now the intraday charts which are shorter term, they aren't as strong, but they have more detail and tell us what's happening in to the bounce so far. As these divergences become stronger, they move to longer timeframes and when they reach the charts above, all bets are off and I'd want to be well out of IWM calls and ready for the next downside move.

 This is the overall IWM 1 min chart before the early run higher from the last post, but the trend is pretty clear.

The IWM 2 min is holding essentially the same trend, but I wanted you to see what happened on the last, early run higher on USD/JPY strength (very light strength)... A negative divergence, again the same trend from all of yesterday, selling in to higher prices.

 And the IWM 5 min chart with the accumulation of yesterday morning's lows with initial confirmation and selling in to higher prices as the 1 min divergence migrated out to a 5 min chart yesterday.

 QQQ 2 min also positive at yesterday morning's lows and also seeing an afternoon negative divergence.

 This has migrated to a stronger 3 min chart so the process is there.

The Q's are just starting to move to the 5 min chart now.

 The SPY 1 min or SPY in general looks to me to be holding up best, but it is still seeing the same underlying trend.

The SPY 3 min showing accumulation at the "W" base and a negative divergence in to the afternoon yesterday.

It too is seeing a move to the 5 min chart now.

This is probably one of the best examples of "gas in the tank" or the initial accumulation of a fairly large block of shares that's being fed out/sold in smaller chunks in to price strength, also allowing larger sellers to sell at higher prices and short positions to be initiated or added to.

That's about where we are right now.

As you saw last night, Leading Indicators as of yesterday's close were about in line, although not leading positive, they too should see deterioration as an early warning signal. Also watch for higher prices and weak intraday breadth via the TICK.

Levers

In last night's Daily Wrap I said,

"Well, I'll let the market worry about how it will get through the overnight session and stick to the objective evidence which is we expected a bounce, we have a bounce, there's still room for more upside, but it's being sold in to fairly heavily so I don't expect it to last too much longer."

There's still gas in the tank for the major averages as they aggressively accumulated yesterday morning's early downside slide, but since then they have also been selling fairly heavy in to higher prices. As I said yesterday and last night, I think there's still upside room , at least there's gas in the tank for one as you'll see in the next post, but I don't expect it to last too long at the rate they have been selling in o this counter trend bounce.

As for the most recent move to the upside, I figured I'd show you quickly how it was done. Remember I said I don't see the kind of divergences in $USD or JPY Futures that I did late last week that lifted the pair Monday and the market with it so I wasn't sure what lever they might be able to use and as of last night's daily wrap above, I wasn't going to worry about it.

Here are the levers...
 ES futures 1 min moving up just now.

The $USD wasn't and isn't showing a positive divergence that would move the USD/JPY higher, it's roughly moving sideways with no divergence.

However, even though the Yen has a small 1 min positive that should grow in to a larger divergence, it did make a move lower in the red box. This in turn changed the stability between the two pairs and....
 Sent USD/JPY higher. Es and the market followed, but that wasn't all.


In addition, I found at least 1 other lever, although not extremely strong and only a 1 min chart this morning to the far right, HYG is leading the market higher or was as of this capture.

I left the IWM $122 calls position open and they are just at breakeven now. I'll show you the bigger picture which is what I was working on as this move started, there is still gas in the tank for such a move, but they have been selling aggressively in to higher prices.

A.M. Update

Good morning.

Other than a slew of government organizations in China creating a buying panic in the last hour of trade, the old "Bang the close " you may remember, sending the SHCOMP up 3.44%, trade has been relatively muted overnight with Europe currently mixed and mediocre.

As for US futures, they look just about the same as they tend to before any F_O_M_C event...
 ES overnight since yesterday's cash close, rather muted with a brief bout of risk on that has been retraced pre-market.

I still don't see any catalyst like the USD/JPY which we saw divergent before the Monday early morning ramp on the carry pair's strength. So As I said yesterday, the catalyst would likely have to be F_E_D related or hitting HYG harder to the upside.

As for the longer Index futures, they are starting to get a little uglier as we expected.
 The charts that were in line like this 5 min ES chart is starting to go negative, these are the kinds of divergences I look for to start new positions although it's pretty minor at the moment.

The  same goes for the 10 min chart, but again it's still relatively minor. If this divergence grows , then I'd say we are getting ready to make a run below the SPX's 200 dma.

The only issue right now is the market still has some gas in the tank from yesterday. This is the SPY 5 min chart, but some 10 min charts also still look good for the near term and I expect they'll stay up until those charts no longer look good. It only took an hour or two for those charts to really shape up yesterday, so I suppose it could go the other way just as fast.

The bottom line is we'll have to watch the chart development, manage some positions and maybe consider some new ones.

Don't forget it the F_O_M_C at 2 p.m. and as always, beware of the initial knee jerk reaction. I don't want to speculate as to what may happen at 2 p.m., but we'll be watching for the leak as we have found them in the past, just not very often.