Wednesday, October 19, 2011

USO Update

 USO 2 min-short term it looks like USO has some intraday/day downside coming.

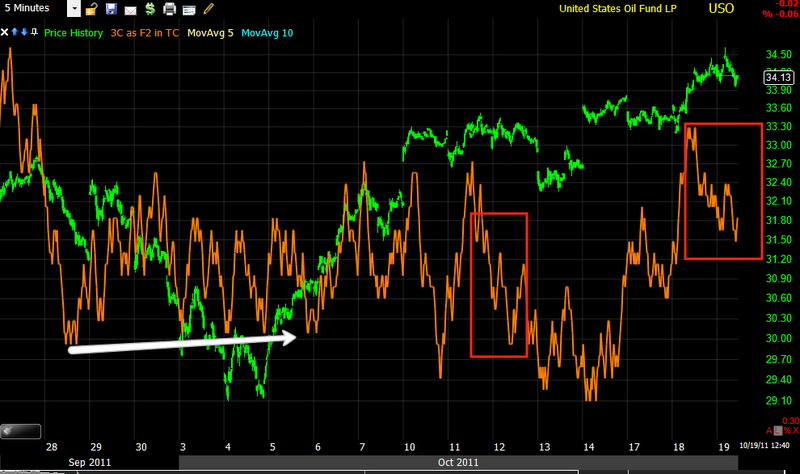
 5 min shows the accumulation area, similar to the market's and 2 distribution areas. This should effect trade over the next day or so.

 15 min longer term, there was a decent accumulation area so now we are seeing a decent size distribution area.

 60 min-from the market top. In this perspective, this last few months just looks like another counter trend rally within a downtrend.

The EUR/USO correlation has held pretty well so I wouldn't expect a lot of movement until the Euro breaks its top, but the same can be said for a lot of markets. The only place correlation seemed to slip is in the white box where first Euro strength didn't translate in to crude strength and then the opposite happened. Being the market (FX) is relatively flat, it opens crude up to movements from supply issues or geopolitical issues.

I still expect USO to move down and most likely continue the downtrend that is in place on a longer term basis.

FX Trade

 24 hour FX trade 1 min- EUR/USD as you can see rallied last night from the close of the American markets (red arrow). Surprisingly, the market FX correlation didn't hold, maybe not so surprising. In any case, had it held, we would have opened higher then we did.

 5 min chart, still looks like a H&S top forming.

Here's the entire Oct. rally, the top is about right in size for the rally.  Once again, it's a process, not an event (most of the time).

This also effects a lot of other trade, commodities, crude, PMs. I'm updating those next.

Market Triangle


 I hate to see this triangle form, hopefully it's small enough that we don't have to waste time with it. Over the last 4 days we are now actually down a little bit, which brings up 2 possibilities, 1) consolidation for a move higher, but I would say we would see accumulation in that case, 2) this is what it appears -a top, but unlike how this rally got started (with 10 weeks of accrued accumulation and a "V" bottom), a top will take longer to form as short exposure has to be added from 0, so once again a top in this case more then others, is a process, not an event. However this triangle I don't like seeing not because of any bullishness, just because it's a waste of time-that's my impatience.

 Hopefully the SPY 1 min chart is showing a breakdown rather then a head fake on it. After all, it's not that big.

 You an see what it is doing to volatility and you know what happens when volatility pinches.

Here's the target chart and since the market overshot the target, and since the next move would be down, I'm hoping it doesn't break above the band again, even though the band has turned from up to flat.


BAC Update

Here's what has hanged thus far since yesterday
 1 min a slight move...

 5 min has a bigger move-leading negative thus far

And the 10 min is turning down

Market Update

Pretty SLOW so far, but it looks like the SPY is probably close to rolling over this time...
Remember that wedge....

An Emma Update

 ES 5 min -so far there's a slight positive divergence that has sent  futures a little higher, still below the close with a current negative divergence that seems to have so far capped that positive divergence.

 Considering the Euro since the close at 20:00,  I'm surprised ES hasn't moved higher.

Here's a longer view of EUR/USD.

An even longer view that shows the entire rally makes the EUR look like a top.

So far I don't see any big news.

These are the futures as of 2:45 a.m.-Thanks again Emma!

In red are US markets, the NASDAQ looks the worst right now down -.95% with the Russell 2k -.76%, the Dow -.31% and S&P -.45%

See ya soon.

Tuesday, October 18, 2011

Full Market Update

 DIA 1 min shows the positive divergence I mentioned in this post yesterday, in which I thought we weren't quite done with the upside. Today however has shown a leading negative divergence, which is the strongest kind of divergence.


 DIA 2 min here's yesterday's strength


 DIA 5 min again yesterday's divergence and in line trade


 DIA 10 min shows a relative negative divergence today


 DIA 15 min this important timeframe shows a continued nasty divergence, the longer/stronger, the more downside we expect.


 DIA 30 min longer term chart, showing a very important timeframe going leading negative.


 DIA 60 min this chart speaks for itself and is one of the nastiest long term negative divergences seen in a while.


 QQQ 1 min this also shows yesterday's strength from this post.


 QQQ 2 min negative into the closing highs


 QQQ 5 min yesterday's strength and inline trade


 QQQ 10 min a relative negative divergence


 QQQ 15 min the important 15 min chart is leading negative (the longer the timeframe, the more important, but at 15 mins, it gets pretty serious).


 QQQ 30 min an even worse divergence


 QQQ 60 min one again this hart speaks for itself, it includes the top in which we saw a very bad downside move from in late July/early August.


 SPY 1 min showing yesterday's end of day strength suggesting more upside.


  SPY 2 min close up a relative negative divergence as well as yesterday's EOD strength


  SPY 2 min expanded view showing the depth of the negative divergence


  SPY 5 min this is the entire short squeeze rally with initial distribution on the 7th, remember how much accumulation went in to this 15 min chart, basically the whole 10 week consolidation was used as an accumulation zone.


  SPY 15 min a leading negative divergence


  SPY 30 min this chart also speaks for itself, especially in this timeframe


  SPY 60 min the longer view of the 60 min, this is the worst 60 min divergence seen in several months


ES 1 min shows very early morning accumulation as was expected Monday, there's distribution in to the highs of the day and now it's leading negative in after market trade (ES trades 24 hours during the week)


 ES 5 min shows yesterday's signal for more strength, this is a relative negative divergence in to today's highs, there's a hint of a positive divergence tonight, we'll see if it dissipates or strengthens. Maybe Emma will wake me again for a very early morning update!

AAPL-A big surprise

With the new 3C depth charts, which is like a MACD histogram for 3C, showing areas of accumulation and distribution, we have an additional tool to look at long term trends and being the depth charts are a new addition, this is the first time I have really looked at AAPL, one of the largest institutional holdings out there and what I found, absolutely shocked me.

 The daily hart stretching back nearly 2 decades shows AAPL has been under slow and steady distribution for the last 5 years or so and is now at the deepest crest seen in decades. Buying/accumulation was very heavy between the early 1990's through 2004, since then, the VERY LARGE accumulated position has been slowly, but surely been sold in to demand and price strength, both of which are essential to move a position this large without causing price to collapse.

 Hourly chart shows accumulation in the summer of 2010, I'm too tired to see what product they were launching, but I'm sure there's a relationship for those who want to investigate it, I'd be interested in hearing what you dig up.

Distribution of that position has been steady and is leading negative as AAPL hits new highs.

 The 30 min chart shows the same with some moderate accumulation  during early summer 2011.

 The 5 min chart shows several smaller cycles.

 And the 1 min hart virtually collapsed during the most recent rally of the last 2 weeks. This will have an impact on the NASDAQ 100.

 5 min regular/extended trade shows the recent distribution in to price strength.

Last night there was short term 1 min accumulation sending prices higher today during regular hours, that position was distributed in to the highs of afternoon trade and right in to earnings. We'll have to see pre-market tomorrow morning, but it appears that there "may" be some accumulation in after-hours, perhaps to try to fill some of the gap we will surely see on the open.

I think the 1 day chart is fascinating, it seems to show the long term strategy of Wall Street and apparently their view that AAPL is perhaps reaching its zenith.