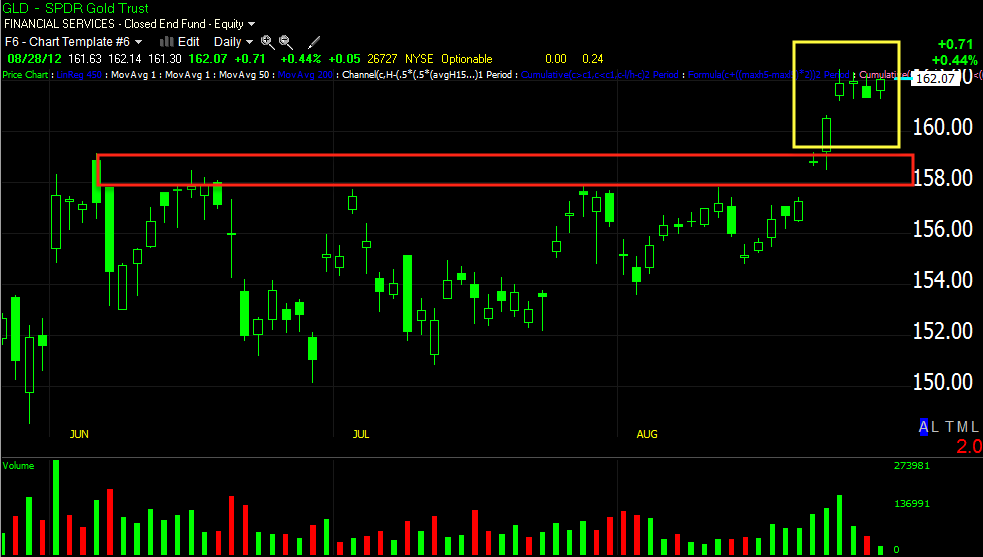
I think we've had enough trades that had no common technical indicators supporting them, did not have price supporting them and in FB's case, were at the time some of the most hated stocks in the market, yet we were able to find something that the crowd missed to make huge percentage gains, often in a short period of time.
I don't know who said it, but it's a common trading maxim, "You have to see what the crowd missed to make money in the market". Another one of my favorites is from Jesse Livermore, considered by many to be the world's greatest stock trader and without a doubt, ground-breaking in his day for his use of technical analysis via tape reading. In essence Jesse said, it wasn't his being right about the market that made him money, a lot of people were right and lost money, it was his ability to sit that made him money. More or less Jesse is talking about not only having good analysis, but having the courage of your conviction to stick with it. As a society we want instant gratification, we rarely have the patience to see a good trade through because we think in terms of hours and days instead of weeks and months or even years; we expect the market to make a huge move in days, but look at a price chart, you'll see that most of the time, the market doesn't do anything.

This trend in the SPY only saw 19 days of 59 that added to the move up, some days only added a fraction (+0.10%). On average, for the days that moved, that's less than 1% a day for those 19 days, so as you can see, an edge and timing a well as patience are key.
Basically any analysis that is based on price and/or volume can be considered technical, while analysis based on value vs price, company dynamics, etc can be considered fundamental analysis.
In my opinion fundamental analysis is fundamentally flawed as you will never have the best, most timely information and you are not likely to be superior in your understanding of how these influence price compared to the multi-billions of dollars spent by institutional money world-wide, but more than anything it comes back to the reliability and timeliness of the data. Can you find something the crowd and Wall Street missed that gives you a significant edge?
Technical Analysis is not my favorite either, at least not the conventional type as it is so outdated, so predictable that Wall Street actually uses it to trade against technical traders. However if you understand (by way of observation) how these pieces work together and you think for yourself, you can beat the crowd, you can even beat Wall Street as you do have some advantages they don't. I have found that patience is a key attribute for successful trading, we all want to see something happen, we sometimes want to make something happen, but being patient and only trading when you perceive the probabilities to be highly in your favor will give you good positioning, it may not be the very best, but often way better than what anyone else is getting and often even better than Wall Street's average price.
One of my favorite stocks this year we have traded very successfully has been BIDU because there are different types of trading strategies and long/short trades, I'll use BIDU as an example of what has REALLY worked.
If you put yourself in the moment of each one of these trades, if you look at how many days are involved, how you would feel emotionally, what the edge and set up were, if you really put yourself in the moment I promise you will gain a new understanding of the market and what is realistic, what is not. I caution you though, when you look at say a daily chart and see 3 weeks of price going no where, it looks like a VERY small, insignificant period on the chart, but if you are in the moment emotionally when looking at a historical chart and think about each one of those long days , your perspective will be very different and that is were you will find the true usefulness of this post and how to best put the odds in your favor and capture large gains. Putting yourself in the moment of a historical chart is the most beneficial thing you can do, it's also the hardest thing to do and almost impossible to teach as I spent nearly 4 years trying to get students to historical charts emotionally, not with indicators and moving averages.
Here's a weekly chart of BIDU...
When price moves up in a healthy rally, volume should move up as well, it may not look like much, but from 2005-2007, that small move in BIDU with advancing volume gained 700% (green). Going in to the 2007-2008 top BIDU fell, the capitulation moment at 2009 was a nearly 50% drop, on the chart it looks like a small pullback, but imagine a 50% move (yellow). Large triangles are often tops or bottoms, depending on the preceding trend, here in BIDU we saw it as a top and looked for opportunities to short BIDU, the red vertical arrow is about where we went short with the core short at approx. $150, giving the core short that is still open over a 20% gain even with the recent counter trend rally up.
Chasing stocks in this market doesn't work, it kills. Stalking stocks and entering shorts in to price strength and longs in to price weakness works, it lowers risk and gives you a better entry. How can we stalk a position?
We have tools that no one else has, we can see things no one else can see, therefore we can plan ahead and wait for the trade to come to us, if it doesn't there's another bus just around the corner. Knowing BIDU had a large triangle, it was more likely to be a real price pattern and not a manipulated one, we just needed confirmation. Although we worked in many timeframes, this is just 1.
There were two triangles, a large top and one following that, we went short at the red arrow after having built a position in this area. While that looks like a small period of time, that was 19 days, almost 4 trading weeks, but the signals were strong, we didn't abandon the trade, we built it. As Jesse Livermore says, it wasn't being right, it was being patient.
Keep in mind, this was a breakout move from a large triangle, most traders were going long BIDU on the breakout, but that is exactly what Wall Street needed to sell in to strength and demand.
The daily chart of BIDU shows 2009 accumulation after a -50% capitulation move, that would not be an easy area to buy, but 3C clearly shows it was the right area to buy, just as it showed the triangle top was in to massive distribution, the probabilities were to the short side as we built long term core short positions, but we didn't need to wait a year.
The yellow area is the smaller triangle after the large top triangle, the 4 hour chart clearly shows distribution in to the breakout move, while other traders only had price and standard indicators to follow, we saw what was under the surface in BIDU. If you have been watching market behavior then you know 80+% of all reversals start with a head fake move like this move in BIDU to multi-month new highs, emotionally that is not an easy area to short, but 3C was with us, market behavior was with us, broad market analysis was with us.
Going in to the July lows we had a positive divergence, this also wasn't an easy area to buy at new multi-month lows, but it was the right area for the same reasons as the short trade before it. Now we have a negative divergence on the counter trend rally from the July lows, we already made over 100% in 4 days with puts on this trade.
Here we see a daily chart, where we first shorted BIDU and continue to hold. At the July bottom we had a bearish chart pattern suggesting lower lows, this was a head fake move that 3C confirmed and many of us bought BIDU for a long, counter trend rally trade around the yellow box. The orange arrow is the exact day we bought puts in BIDU on a breakout above resistance, we made over 100% in 4 days and closed the trade because we suspected a bounce in which we can short in to strength, we were right to close the trade when we did, we opened and closed the trade on the exact right day in both cases.

This 30 min 3C chart shows the bearish price pattern area in yellow, it even broke down on a head fake move and 3C showed a positive divergence at that point, this would not be an easy area to buy psychologically, but it was the best area to buy. After that 3C confirmed the upturned, also confirming our suspicions this was more than a bounce, it was a counter trend rally, then distribution started. We now knew the next trade was near, we just had to be patient and wait for it; it was worth it with a 100+% 4 day return.

Here's a closer look at the area distribution of the large institutional position had started, but a head fake breakout is always a good timing indication, I personally bought puts on the day of the breakout for a great price. 3C makes deeper lows in to that breakout, it's obvious buyer's demand is being used by smart money to sell/short in to. The hourly chart right now is leading negative, this tells us the probabilities are to trade BIDU short, but we need a timing signal to enter the trade, that's what I'm waiting for with BIDU now while I maintain the core short position which I also added to on this price strength.

Here again is the bearish price pattern at the July low to the left and the break below it, BIDU lost 15% is 4 days, the puts made much more, some members made 250%. The support area at the gap was one indication that the short term trade was over, 3C was another, the rejection of lower prices on Thursday was another. To illustrate the difference between Fear and Greed, the two emotions that move the market, it took 18 days for BIDU to move up, BIDU erased those exact gains in 4 days, fear is stronger than greed, however, the head fake move also plays a large part in kick-starting a reversal, the bulls trapped at a loss sell and price falls faster.
The short term 3 minute chart gave us warning BIDU was about to turn, part of the trade was closed Wednesday for 102% gain, the other half was closed the next day for nearly the same gain.
This chart is still telling us the probabilities are high that BIDU bounces, this is what we want, we just have to be patient and wait for the bounce so we can start a new position short position. If BIDU moves lower from here the core short will benefit and we will have missed the short term trade, but we did the right thing in waiting for the trade to come to us. I'm sure many others are short BIDU right now because they waited for price to move down, they will likely be stopped out on a bounce higher, WE DON'T CHASE TRADES, WE LET THEM COME TO US.
This is a 30 min chart of the BIDU head fake lows, confirmation and the downside reversal in to a breakout above resistance. Again, put yourself in the moment, it is not easy to short a breakout, but we have information others do not, we understand market behavior in ways others are trapped by.
Looking at more time fames, the hourly chart clearly tells us which way the probabilities are, patience.
The 2 min chart shows BIDU is likely to make some higher prices, we want to see that and this chart go negative as those higher prices are made, maybe even some sort of head fake move.
The 3 min chart is more important than the 2 min, it is not as strong, but still suggests higher prices. The fact this chart is not as strong also tells us something about the character of the bounce, it should be a bounce, not a strong new counter trend rally.
At 5 minutes, BIDU barely shows any strength, confirming what I just said about the 3 min chart and the strength of the move up.
We have had 4 major trades in BIDU, all profitable, but each with their own character and challenges, each required doing something that is emotionally hard to do and that is to ignore price and short breakouts and buy new lows.
If you can look at each of the trades and put yourself in the moment of buying a new breakdown low or a new breakout high, put yourself in the moment of sitting in a short for several weeks and even adding to it while price was flat, hopefully you'll gain new insights in to how the market works or how deceptive price can be, you'll also learn that 1 day is a VERY short period of time, although when we experience that day it seems to be very long and important. You'll also see that most days the market does very little, it's only a few key days in which the biggest gains are made.
Each of you trades a little different, each of you are unique, take these examples and see how you can apply them to your trading, risk management and understanding of the market.