First lets look at the currencies because these are what move assets like gold, oil, stocks, etc. Wouldn't it be interesting if the currencies aligned with the other indications put forth ($AUD already has)?
The $USD proxy, UUP...
1 min $USD shows a late day negative divergence yesterday, this morning's gap down fulfills that divergence, but look at it now, it's building and a higher dollar means lower stocks, commodities and GLD historically. So early on we are seeing what appears to be the dollar accumulated in to weakness and at a level where there would be some supply...
Daily chart of UP/$USD under the support of a "Tweezer bottom".
Longer term, does the $USD show the strength that would confirm 5 min weakness in the market, yes.
Remember the $USD trades opposite risk assets like stocks, gold, oil, etc.
How about the bigger picture? The 60 min chart in it's largest leading positive divergence on this chart, that also doesn't bode well for QE3 at Jackson Hole or any other time this year.
How about the Dollar's opposite, the Euro? It had the positive divergence late yesterday to send the Euro higher with stocks, but it can't confirm this morning. In fact...
It's VERY far from confirmation as this 1 min chart makes no effort to confirm at all.
Longer term, the Euro is in a head fake position above resistance, but with a leading negative 3C divergence, if I was interested in shorting the Euro, this would be the place, but since stocks and the Euro tend to move together, I feel I can get higher beta with stocks.
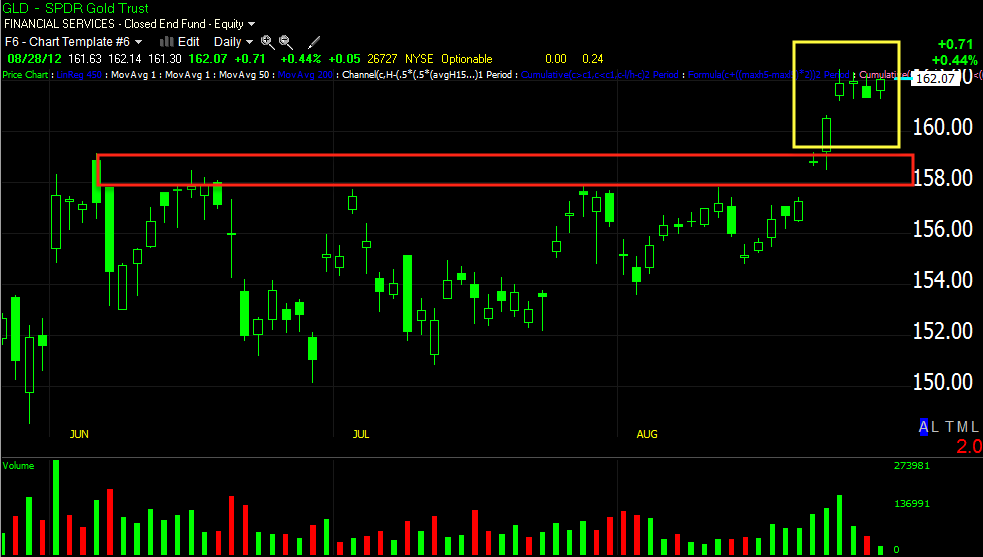
Interestingly, if QE is not coming, then now would be the time to dump GLD for institutions as they need to raise money for redemptions and on a yearly basis, GLD is one of their most profitable positions, note the move above resistance where there would be retail demand that institutions could sell/short in to. I use yellow boxes to denote suspected head fake moves.
GLD 1 min trend since the breakout, not looking good.
GLD 1 min this a.m.
GLD 5 min trend since the breakout. This looks like the distribution I mentioned above.
The hourly chart though is where the weight is.
If I didn't already have GLD puts I would consider them here, if GLD can move above the resistance of the last week or so, I'd consider adding to the position.
Remember, oil acts similar in the same position that the $USD and Euro are in.


No comments:
Post a Comment