Friday, August 31, 2012

AAPL Update

In the last post I mentioned the ES 5 min chart may be enough to keep intraday volatility swinging back and forth. I would expect if there was to be such volatility we would probably expect to see a broadening pattern intraday, with deeper lows and higher highs.

The AAPL chart gives some credibility to this theory and hopefully the AAPL weekly calls can be sold on one of the upswings and longer term puts can be entered or just short the stock (which is my preference for longer term positions), at one of the highs.

The intraday vs trend in each timeframe and the short vs long term charts seem to support this as well. I absolutely cannot look at these charts and not be short AAPL, I don't know how anyone could be anything other than short AAPL, they are that bad (weekly calls are a different story obviously).

 1 min  reacting to the latest intraday movement

 2 min seems not to be quite as ugly intraday.

 Look at the trend though, this is the same spot I said I believe the market already topped at this week.

 3 min chart is in line, not so bad intraday.

 3 min chart trend, just falls apart at what I believe to be the head fake/reversal spot.

 5 min chart is positive enough to expect AAPL to see more intra day moves higher.

 5 min trend falls apart with heavy distribution at a break above resistance to the yellow area.

 Longer term 5 min chart, resistance is broken, 3C deteriorates more as it is broken, this is a clear picture of how smart money operates, each new breakout brings retail longs in providing supply for smart money to exit/sell/short.

15 min chart suggests enough strength to see more AAPL intraday swings to the upside.

 15 min chart, 3C's downside momentum increases with every breakout.

30 min chart, $600 is the first level in which AAPL sees major distribution, it gets worse the higher AAPL goes, this is the very simple concept of selling in to strength, we are not use to it because we don't trade in such size that it is necessary. Remember a while back I said I believe AAPL will have 1 major accumulation point and then just sell those shares in to higher prices until AAPL reverses? There it is back in may at the absolute lows, this isn't the first time we have seen it, the point is that since then, there's never been another major accumulation area.

S&P/NASDAQ Futures

A quick look, this is a very fast moving market, the knee jerk effect was in full force, it still may be.

 ES leading negative 1 min

 The ES 5 min chart may have enough support left in it that we see more of this volatile up and down.

There are a lot of confirming charts to check.

NASDAQ Futures leading negative, there was no positive divergence at the lows that bounced back up, this is pure knee jerk effect of the F_E_D as always

Here we go again

Knee Jerk!

There are some very negative signals in the market right now. Still have lot of time, but these are looking bad.

GLD, GDX (gold miners) and DUST (3x short gold miners)

In this post from yesterday morning, the very first chart is GLD 1 min showing a high probability of GLD moving to the target range I've patiently been waiting for.

The post also covers GDX and DUST and gives the target areas in which I'd be interested in a short on GDX and a long in DST, here are the actual target ranges from yesterday's post.

 DUST target range below the yellow trend lines, we are moving in the right direction, but not quite there. Of course a position could be taken here, I just feel that in a market like this it's best to demand higher standards from the trades, better entries, less risk.

Here's the GDX target range set yesterday.

As for what's happening with miners today, the signals in DUST are confirmed by the signals in GDX (which are opposite), it's hard to see these signals and not consider going long here despite the target area not being hit. I think if I had to make a decision I would choose a partial position leaving enough room on the risk management side to add if the target zones are hit.
 DUST 1 min very positive, yesterday it was negative, so 3C seems to be calling these intraday moves nearly perfectly here.

 2 min is seeing migration of strength from the 1 min

 The 3 min is in line and hasn't seen that migration of strength yet, but I suspect it will.

 5 min remains in a leading positive position, apparently the distribution to cause the decline in DUST was not all that strong, just intraday as the move thus far has been.

The big picture, 60 min leading positive in DUST.

It's a tough call, don't let greed get in the way of solid analysis and patience, there are good signals thus far, we aren't exactly at the area we'd like to be at, if I was really serious about long DUST or short GDX I think I'd have to compromise and look at a partial position as mentioned above.


GLD Charts

Well patience paid in GLD, I've been waiting for GLD to hit this price level nearly all week, even yesterday when GLD looked like it was breaking down, I stayed patient and stayed with the short term signals that showed the probabilities were GLD would move to the level I was looking for.

Now lets see if patient $PAYS.

Here are the GLD charts, I wouldn't have entered the Put if I didn't think timing and probabilities weren't on our side here.

 The exact entry area I've been looking for in the small yellow box.

 Here it is above the red trendline on a 60 min chart. Also note the parabolic price move, that doesn't hurt either, a 5 min chart shows it better.

 The 1 min chart looks the way I'd like to see upon breaking above that resistance level.

 As does the 2 min chart

 The 3 min chart

 Certainly the 5 min chart because of the step up i importance and the step down in the readings.

 The 15 min chart which is just turning down now if you look closely.

 The 30 min chart has been ugly here, this is why I just wanted the price concession.

And the 60 min which has given us a number of excellent signals for very successful trades.

GLD Options Position

I'm going with a normal size option position in GLD puts, strike $165, but half in October and half in September.


"IF" the ECB is about to get all this power

Then why in the world are some of the best informed traders (Bond market) sending Spain through the roof? I now there's trouble with the regions, but that was there yesterday.

Spainish 10-year debt in red, Italian in Black. What is up here? This directly contradicts Gold as the ECB is the only game in town right now.

GLD is Pushing through my target...

I'll be paying attention here and seeing when/where I will likely open a put position.

FB Update

I'm not giving up on FB either considering all the stop hunting from the Euro to AAPL, in every direction, up, down, sideways if they could.

The FB charts...

 At the first bounce in August, some of us went long, but as soon as I saw the divergences suggesting the bounce I also warned not to expect much as I believe FB was going to build a larger base that would support a larger move. At first I thought maybe a "W" bottom, obviously it wasn't that.


 Now it's looking more like a rounding bottom, but if that is a head fake move this a.m. then FB would be a lot closer to breaking to the upside than a rounding base would suggest.

 For traders who hate FB any way, drawing trendlines like this isn't such a crime, this portrays a bearish descending triangle, the problem is it's too big and the trendlines aren't correct, but that's always been a problem in Technical Analysis, drawing trendlines to fit your outlook. Drawn correctly you actually have a bullish descending wedge. `

We had almost a year's worth of lessons on how wedges now act, rather than what Technical Analysis textbooks have taught for 6 or 7 decades, anyone remember?

Not that it really matters because drawn correctly FB is still in the bullish descending wedge, but the behavior we have seen over and over again for nearly a year while wedges were everywhere was not the breakout to the upside at the apex, it was a head fake breakdown making technical traders think the pattern failed and with the sentiment toward FB, technical traders would love that, then only after a trap was set did they either go laterally and then breakout as they are expected to or they just made the head fake move and then broke out as they were originally expected to, just another example of how a classic price pattern is manipulated, but technical traders refuse to adjust to the new realities of Wall St. manipulating them.

 Intraday -1 min positive

 The 1 min trend, leading positive

 5 min has a large relative positive.

 the 15 min has the most bullish, leading positive divergence FB has seen.

 The hourly chart is much higher than it was at our last successful long trade.

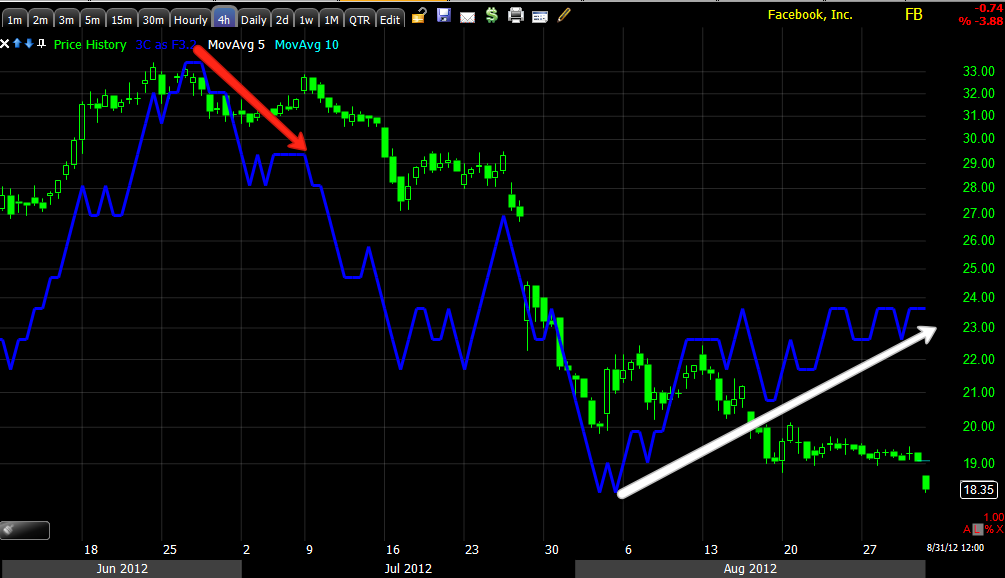
To clear away all noise and uncover trends, here's the 4 hour chart, a clear negative at the top, a clear positive here.

Since FB is a new issue we don't have much data for the daily chart, but what we have is positive right here.

I'm going to wait until today settles down and see what develops and decide if I want to take any action in FB, I won't be closing the currently open positions though, I don't have a reason to.

Nothing can be trusted this a.m.-GLD

I'm very close to pulling the trigger on probably October GLD puts, here's what I was looking for, here's how close we are and what the probabilities are looking like.

 GLD reacts totally opposite of Bernie's comments.

 Above the red trend line is where I want to look at GLD puts.

 The 2 min chart looks like it was prepared to move GLD higher VERY short term, but after that?

 3 min chart negative

5 min chart very negative.

It looks like the set up I anticipated and have been waiting for in GLD is playing out, whether we get above the red trendline is all that's really left as a question for me.