Wednesday, May 15, 2013

TLT

 TLT 2 min accumulation continues after the stops were hit, this is a move toward safety while risk in the SPY is under distribution.

This shows the SPY 10 min chart specifically on today's risk on move, which is a much larger underlying flow of funds.

SPY 10 m, I don't think I need to draw in the divergence, if funds were flowing in to buying the SPY, 3C would be moving with the SPY.

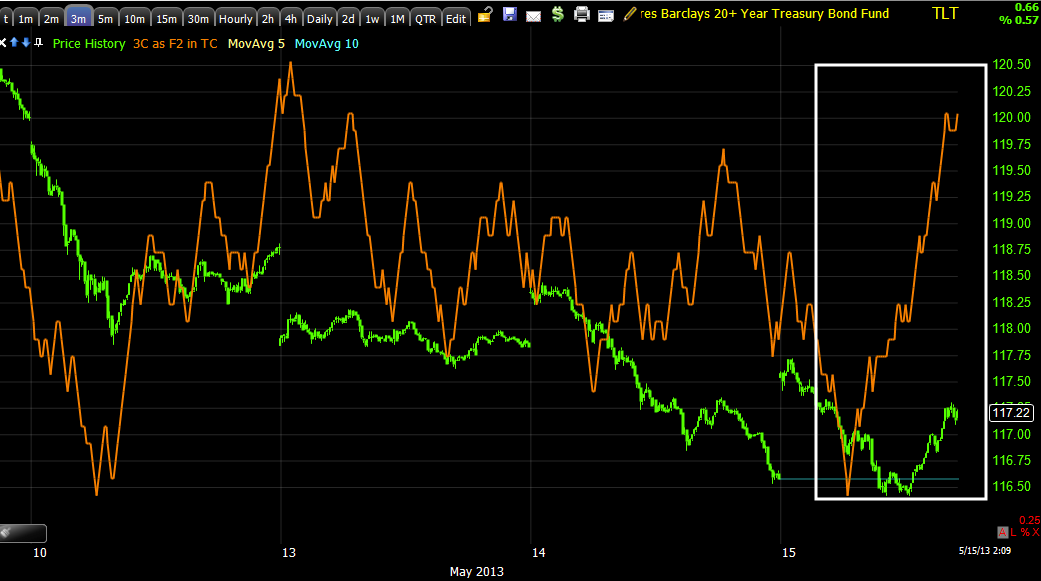
TLT 3 min migration-this from an early in line status on the downtrend with no early positive divegrences.

TLT 5 min.

As I said, risk is being aggressively sold everywhere in all assets including the stock market although harder to see, protection or safety is being bought.

Risk Assets

While I'm re-setting on of my feeds, I want to show you a little more information, risk assets are broadly being sold off, CONTEXT alone can tell you that or HYG yesterday.

 CONTEXT shows risk assets are selling off hard vs ES

Here High Yield Credit has been being sold the last  4 days aggressively-it's just not scaled very well.

the $AUD is sinking

The Euro is sinking-niether of which did anything for the market today, in fact they are implying the exact opposite, especially after the European GDPs.

HIO is showing a risk off sentiment

HYG credit has been sold very hard, CITI has confirmed it as well as posted earlier.

HYG really had nothing to do with the market moving today-it was the Yen weakness on a pullback as it is reversing as the dollar did.

Junk Credit also selling off

And the large $USD base reversed from the pullback and has broken out-these are major problems for the market, what looks like risk buying, is risk dumping, retail just doesn't get that and sees it as the opposite, but every other class of risk asset trader is doing the exact opposite.

TLT taking out stops as mentioned earlier. I'll have to check the accumulation that was starting there.

 VXX seeing demand even in to a rally move?

VXX also having support, it should be at a new low according to the SPX move

So everywhere we look, risk assets are being sold, protection or flight to safety are being bought, the only thing that separates all of this from being acceptable in our heads is market price movement, as I say though, price is deceptive, although if it were that easy, everyone would be a millionaire in the market so no one would be.


Is every other form of Credit, FX, futures, bonds and other traders wrong and retail equity right?

Be very careful with market linked long positions.

Market Update-Market Key-For Now

I'll go in to greater detail later , but now we have a key ingredient in what moves the market. The divergences in the Index futures are extreme, I'll start with those, this is along the lines of "aggressively sell or short" on any opportunity, it happened as expected in HYG yesterday although it should have made a far larger move. These aren't small divergences in Index futures.

 ES (SPX futures) -Note in yellow there was no accumulation in ES, something else moved it, not the typical accumulation cycles.

 NQ (NASDAQ 100 futures) which already lost significant ground since the divergence

 TF negative divergence

Here's where it gets interesting...
 I put the Yen next to the SPX, note that when the Yen (orange) breaks below its trendline today, the SPX breaks out and as long as the Yen moves lower, the SPX moves higher, look at the top area.

This is an updated zoomed in chart on the same chart...
Here it's the SPY (green) and yen (red), the same top area, they are almost mirror opposites of each other. I thought this would happen, but on a large scale, not down to intraday movement.

When you see the other risk assets and how they refuse to participate, thins start falling in to place.

Yen Futures 1 min went negative on a pullback divergence, when it started going positive, the Index futures started going negative.

 The larger 5 min chart with a leading positive divergence off the last pullback that sent the SPX higher, this is why the negative divergences on the Market Indexes are so negative.

 The 30 min Yen has an even larger positive

But if you think about the larger market picture, the leading indicators, breadth, 3C charts and other things suggesting the market is in big trouble in this area, look at the 4 hour Yen chart, this would be a huge move up, also note why it has been going down, the market has had no headwinds.

It looks like this is starting to change as it did with the USD pullback, now at new highs which I think will also be a large factor. I'll try to show you this in greater detail later.


If You Like the GOOG Trade-Take a Look Quick

For an equity short, I love the GOOG short, for options I think it can work, pretty expensive. For an equity short, it's in a fantastic, low risk area.

Take a look because I think the stock won't be up here much longer.

Got It...

I'll post the charts in the typical update, as I'm looking through the Leading Indicators I see the market totally disconnected from any other risk, it's in a land all by itself, a little hard to believe that it's all SPY Arbitrage, then as I have suspected and shown several times, when I got to the Yen, there the answer was staring me in the face. You can check out FXY if you don't have Yen futures, but I will show you.

This is exactly what I predicted in the 2 articles that took me 10 hours to write, "A Currency Crisis" part 1 and 2, which are now both linked at the upper right side of the member's site. I think we need to be paying a LOT more attention to the Yen which is going positive on 3C right now.

I know it seems as far removed from common sense and everything you've learned about the markets, but these are not normal times.

I suspected the market would be increasingly controlled by the Yen and $USD, it has been, today is another example, but with the $USD making the move it did yesterday and the Yen making the intraday move it did today, the markets today all of the sudden take on a new purpose and meaning, this is why it's so important to look everywhere. The new purpose and meaning, get out of anything risk at any opportunity which the Yen provided, ASAP. I know it doesn't feel like that, but that is what everything including Mr. Tepper's portfolio are pointing to.

Rare Re-Post-This Why You Always Assume They Lie

This why I don't watch CNBC, this is why I don't listen to their pundits, I've seen this dozens of times, but for some of you, this may be your first. I don't like reporting other people's material, especially not analysis, but this you have to see. From ZH.


Back in September 2010, following David Tepper's first "balls to the wall" appearance on CNBC, we were not very surprised to learn that the seemingly permabullish hedge fund manager had taken the opportunity to follow up on the brief euphoria his speech generated then to cut 20% of his positions inassorted financial stocks - just the stocks he was praising loud and clear to the financial station with the plunging viewership.  Moments ago, Tepper's Appaloosa filed its 13F for the quarter ended March 31, so yes, before his most recent appearance yesterday. Yet we were somewhat confused by why the manager, once again so bullish he could see no scenario that could send stocks lower, and who estimated a war in the middle east could lead to a mindblowing 5% drop in the market, decided to trim his core holdings.
To wit:
  • AAPL, which was his biggest holdings at December 31, with 912,661 shares amounting to $486 million, was trimmed by 41% to just 540,000. Perhaps he was merely locking in the losses during one of AAPL's worst quarters in recent history?
  • Citigroup, currently his top stake with 8,519,547 shares amounting to $377 million: stake cut by 7.3% from December 31.
  • United Continental Holdings, currently his second highest stake with 8,508,613 shares amounting to $272.4 million: stake cut by 6.7% from December 31.
  • AIG, previously his third largest holding, and the latest and greatest hedge fund hotel darling: stake cut by 28.6% from 6 million shares to 4.3 million
And so on.
In other words we wonder: was Tepper's appearance yesterday simply to frontrun himself and to give him the opportunity to buy stocks he likes at higher prices, or, and it pains us to even contemplate it, sell more of his exposure to suckers?

Charts

Before I switched Layouts I just wanted to get the charts out to you so you aren't flying blind.

I also forgot to mention that as TLT made that low below yesterday's after filling today's gap up, there was large volume, then the positive signals started building, this is just an old Wall Street trick for picking up shares without anyone asking questions, if they bought them any other time traders would be chasing them, but they never seem to ask, "Who takes the other side of the trade" when big stops are hit, when we see 3C positive divergences on that stop run, a form of ahead-fake, we know who took the other side - quite ingenious and insightful to the human psyche.

 DIA actually looks to be one of the worst when going through the different timeframes.

The IWM and the level I forgot to mention

QQQ has the worst relative performance, everything else is around .50 and Q's at .15, but look out for AAPL. If I were back in my day trading days, I'd take AAPL long here with a stop just below the intraday lows.

SPY

If you want a good read on a reversal point, set up the intraday NYSE TICK chart (1 min), draw a channel around the trend and wait for the break of the channel. It should be soon.

Going to Leading Indicators

Levers

Just after a quick look, before I could even post the chart, I was going to show you that I thought IWM +<$98.52 would be an important area to hit before anything turns.

Quickly, TLT just dipped below yesterday's lows and is now starting to find 3C support-this is why I was saying earlier there may be a position there as some of you seem interested in TLT, but to wait for the charts to go positive, that is happening now.

HYG spent enough time accumulating that it should have been able to make at least a $1 move, instead on the start of its move yesterday it was quickly sold, you saw what CITI said about HYG this morning as well, confirming the signals we've been getting.

I'm very surprised HYG hasn't done better with the accumulation it has in place, but so far today it hasn't been able to make a higher high. It would be interesting to see if it could break out again and then what happens, if the same as yesterday-almost immediate distribution?

VXX is seeing accumulation and moving higher as well, this should start to flip the SPY Arbitrage somewhat and probably has something to do with the building negative divergences in the averages and Index Futures.

Keep an eye on AAPL still, it has made a stop run below the range, so that's a possible head fake area to start a bounce from as the rANGE TODAY WAS VERY DEFINED AN OBVIOUS,stops would have been right under the range.

The most interesting thing is if HYG fails and doesn't allow whoever accumulated a decent (bounce-size) position, they'll be out of that money, again the same exact thing happened to AAPL, there was an accumulated position, Dan Loeb's 10Q came out and all heck broke lose.


Market Update

All Index futures and all of the averages are now at a negative divergence, it should be large enough to turn the market down.

USO is up as mentioned as well.

We'll be looking at Gold now that it took out the centennial mark of $1400.

I'll be checking Leading Indicators quickly.

CONTEXT is even lower at -27 as of 30 mins ago.


GS Still Looks Good

Lots of interest in GS! I guess not too many people like this company for obvious reasons. In any case to answer a lot of emails with one post, yes, GS continues to look good. I still prefer a longer term Equity Short, but I also couldn't help but dip in to a small put position as you know.


 Intraday 1 min GS continues to see lower 3C lows and hasn't made a higher high, a sort of short term churning.

The 2 min chart's longer trend view also still looks good even intraday

The 5 min chart showing yesterday's move that was the trigger and today's is the first institutional timeframe and it's seeing lower 3C lows and highs

The 15 min is also seeing a large negative here as well as intraday between yesterday and today (red box).