Thursday, November 14, 2013

Opening VXX Dec. $45 Call

This is speculative and rather than using the 2x leveraged UVXY which I think can work too, since I'm not certain on trade duration, I'm opting for more leverage, but defining the risk via calls (premium is the max risk).

This has bearish implications for the market, at least a rising VIX does.

Volatility seeing big accumulation/ Credit Distribution

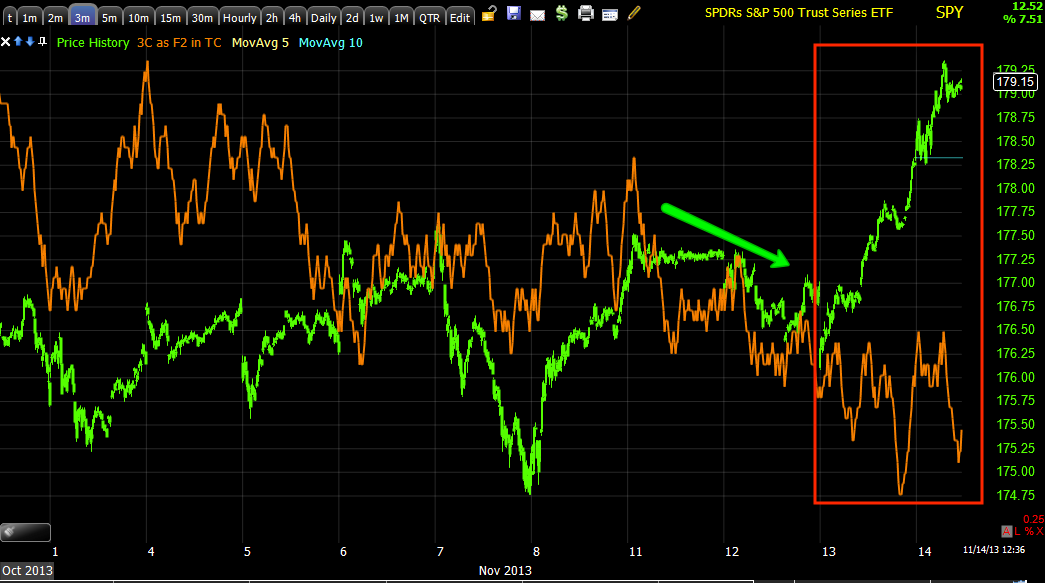
This is just 1 measure of the market, but this is EXACTLY what told us the SPY arb and market forces were moving bullish yesterday 45 minutes before we say a real move. Right now, these exact same indicators that gave warning yesterday are reversing giving warning today, they are bearish in their signals. I'll have them up shortly.

The 5 min ongoing negative Index futures could not have helped, that may in fact be why these are rolling over.

Charts coming as well as XLK/TECS

PCLN Update

PCLN is a partial Core Short that is waiting to be filled out. Yesterday's update was "Will Wait on PCLN" the reason why?

"As everyone here knows, I'm not a big believer in sudden reversals or "V" reversals and considering the daily chart in PCLN... With this candle-if it holds in to the close, I'd have to expect a pretty tight "V" reversal and reversals just aren't (or VERY rarely are) events, they are a process. I'd think at least 1 or 2 days maybe to form a reasonable reversal process if it started tomorrow"

There's a lot more including a Trend Stop out level in the post from yesterday so I'd take a look at it if you are interested in PCLN.

Thus far today, the daily candle in PCLN is just as imagined and so far perfect, another star/Doji in the area with a bearish confirmation candle would give us an appropriately sized reversal process rather than a "V" shaped event that is very rare.

The charts for today, so far so good.
 PCLN Daily chart. As you can see in the last few PCLN updates, I have said I would not consider adding the other half on the core short (as this was planned to be a phased in position) until PCLN broke OVER $1100, and the reason for that was behaviorally from the market, the range in place suggested the probabilities were for such a move, but likely a head fake move/bull trap.

For longer term analysis, see previous updates.

Yesterday's large, bullish candlestick was VERY unlikely to just reverse down today no matter what 3C says, it's too tight and no reversal process, there's a reason for the process and why "V" reversals are so uncommon.

Today's star is a near perfect second day candle, one more would make the process a little wider and a bearish confirmation like a bearish engulfing candle would round PCLN's reversal process.


This is what we were looking at and talking about in the IWM as well, a downtrend and then a channel buster on the upside that looks bullish, but it creates fast downside momentum which slipped below the lower channel and created another channel buster that looks bearish, but this we'd expect to move up quickly (remember that when looking at the IWM's).

In yellow we have the bull pennant and 45 minutes before it broke out I posted the intraday charts suggesting it would and the longer term charts suggesting the breakout would ultimately fail and become a head fake/bull trap.

In green is yesterday's breakout which moves above the recent intraday highs range, that's the target and why I wouldn't enter before PCLN was >$1100.

 This is the entirety of that process since the Channel Buster and now we need to see the right side of a rounding top or another similar top pattern.

The intraday charts were negative already at the bull pennant and the breakout after it, even worse today which is what we look for to identify a head fake from the real deal.


Intraday on today's star we have an intraday negative which is perfect, typically on the 1 min only it creates a lateral consolidation, at the 2 min the probabilities of a pullback go way up, I would prefer we range laterally in this area for another day or so, the 2 min chart is negative, but not that bad so the changes of another star/Doji in this area are good and that gives us a more proportional process as they tend to be proportional to the preceding trend or their trading character.

So, I'm not making any moves in PCLN yet, but what we hoped to see yesterday did develop thus far today.

Another day or two could be the sweet spot to fill out the rest of the position.

I will say that I am being very myopic when you consider the bigger picture, but that's my job. For those who prefer more confirmation, the break of the Trend Channel for the entire 2013 trend is in yesterday's post linked above, the area is under $1018 on a close. While this probably wouldn't be the best/lowest risk entry, it would certainly have undeniably high probabilities.


GDX, NUGT, DUST

I think it's pretty near high time to make a decision, GDX calls have come back in a big way for me. These are December so I have to weigh whether I think this is likely a gap-fill from today's gap I'm seeing in the charts which I'd probably hold for or something worse.

As of now, I'm really on the fence, but I'm leaning toward gap fill, just because the larger base is so well developed.

  GDX larger base (60 min) with a leading positive divegrence.

GDX 5 min sending it up, this is still leading positive, if there were to be some heavier damage that changed the 5 min chart, I'd know it was more than a gap fill and would have to act on trading positions-not core long term trend positions.

 GDX 1 min intraday, you can see my concern

GDX 2 min intraday with 3C migration to longer timeframes.

NUGT should have the same signals as GDX, it is just 3x leveraged. The 5 min leading positive and then just holding today.

 However, 1 min leading negative like GDX

3 min positive yesterday sending NUGT higher today, but a 3 min leading negative today.

DUST si the exact opposite of NUGT, the 3 min leading positive confirms the weakness on intraday GDX and NUGT charts, but it is still only a day and 3 min, this leads me to believe a correction to fill today's gap is the higher probability and with December expiration (this could even be op-ex related I suppose as it is tomorrow) I think that's plenty of time to allow GDX/NUGT trading positions a little more room, but this is a decision each of us has to make based on your risk plan and tolerance.

If things change, I'll let you know

Post Yellen Market Update

Most of this morning's chart have been very dull as mentioned several times, I'm not surprised, I doubt anyone is making any big moves while this uncertainty is ongoing.

Here's a look at the market averages, the IWM is particularly interesting to me because of the Channel Buster and its charts as well as the fact it should lead risk on moves and the dispersion between it and other indices.

SPY
 Like most 1 min average 3C charts yesterday, this one is in line, this simply means there's no apparent underlying action that should upset the trend, it's also what I call 3C & price trend confirmation, but it is also the weakest chart so the indications there are generally for intraday moves only unless viewed as a long term trend.

 However when we get to a more serious timeframe that would require some real underlying investment in the SPY yesterday, we see that it was not there, it was as if, "If the market goes up, fine, but we are not investing in this run up".

 The 5 min chart shows the accumulation area first saw last Thursday and Friday was the first day price responded, I called it a "mini cycle" based on the size of the accumulation area, if we look at SPY price since, it's very much in line with a mini cycle.

Furthermore, the warnings I've had every day this week and in to last week as we had 2 and a half trading weeks of lateral chop creating a very obvious range, makes a head fake move (which we should see any way on a cycle this large, since the 10/9 lows) even more likely as more limit orders pile up just above resistance and stops as well.

 There are many reasons for a head fake move, but the least of them are still compelling, all of the money to be made just on the bid/ask spread when triggering all of those orders and volume rebates.

This is why I say that I watch for an Igloo with a chimney (a rounding top with a head fake move on the upside that fails).

 QQQ 1 min also intraday in line yesterday and most of today (the dull action).

The 3 min chart looks a bit different than SPX, but there's a lot of dispersion between the averages, still a negative in to today, but somewhat small.

 The 5 min QQQ looks to be in line which is interesting as Tech is underperforming badly, recall yesterday's XLK update.

IWM
 Intraday IWM 1 min is negative, yesterday's close is the yellow trendline, it has been struggling this morning.

 This 3 min also shows the mini cycle which just happens to coincide with the drop below the channel to the lows (channel buster on the downside creating upside channel buster momentum) and the current channel buster (yellow) with a negative divegrence, but the real interesting chart remains the 5 min.

 IWM was in a clear down trend of lower highs and lows before the channel buster, but look at the 5 min divergence in to the upside channel buster (which is typically a bearish head fake move).

Index Futures which went 1 min negative last night after Yellen and then surprisingly quickly 5 min negative.

ES/SPX E-mini futures
 ES 5 min

NASDAQ 100 futures 5 min leading negative


And our TF/Russell 2000 (IWM) leading negative 5 min futures chart.

This at least gives us a post Yellen base line

GDX, NUGT and GLD

Gold is a QE sensitive asset, although it has shifted correlations over the course of QE quite significantly at least once.

I really wanted to show you the GDX/NUGT charts, as I said earlier, if there were any Yellen pop above current levels, I'd be inclined to close short term trading position, however longer term GDX or NUGT core positions I prefer to keep open because of the charts that are consistent with the objective of those positions.

My earlier point above is gold should show some of the sentiment regarding Yellen's comments, but as with everything F_E_D or Central Bank, always beware the knee-jerk reactions. 

We saw this with the ECB's surprise rate cut a little over a week ago, we saw the knee jerk on ECB/WSJ comments yesterday and then very little from Yellen's pre-released comments last night, the point remains, the ECB  has had time to show the knee jerk and the rate cut failed after an initial knee jerk and even yesterday the Euro's knee jerk only lasted about an hour or two.

  Short term positive divegrence in GDX yesterday and the pop today, I'm a little uncomfortable with the support for this particular move.

 This is the intraday deterioration in GDX I just mentioned in the previous post, it's still intraday, but this is where new divergences start.

This is the 3 min, positive yesterday, popped today and really in line so far, if that 1 min gets worse, it will move to this longer 3 min chart and the probability of a pullback goes up, however those no accounting for Central Bank statements beyond what the market is reflecting or discounting above.

NUGT 3x long GDX (gold miners)
 This large positive divegrence and rounding bottom is EXACTLY why I want to maintain the NUGT core or GDX core long equity position.

 Shorter term, again a 5 min positive divergence and a fairly decent one should support NUGT, however I am a little nervous about intraday action. I haven't taken any action on trading positions yet, I'd like to give this more time to develop AFTER Yellen if possible.

 Yesterday's 1 min positive and today's pop which we have been expecting. However, intraday this is dull at best.

 Again, this 2 hour chart/positive NUGT divergence and rounding bottom, this is why I continue to like the longer term prospects for GDX/NUGT/gold miners

This is the basic look of GLD today, positives off head fake / false breakdown or shakeout, a leading positive yesterday and price pop today, however intraday action is again, at best, Dull.

Again, if there is a Yellen based pop from here in GDX especially and maybe GLD, I'd be very seriously looking at closing December Calls on such a move and regroup.

NUGT and GDX

Are both seeing clear intraday negative divergences, this may be a gap fill as mentioned earlier, but I also made my reservations known short term, the longer term core GDX or NUGT positions will remain in place, but I expected we might see some weakness in GLD and or GDX, it seems GDX is seeing that weakness starting up in inrtraday 3C charts very clearly.

Market Update

There's a lot of dispersion in the market, for instance SPX vs Russell 2000 or XLK (our TECS long yesterday) vs XLF.

There are intraday negatives which have largely been in line to slightly weak, but very dull otherwise, are now starting to become more clearly intraday negative, the IWM especially. This is seen in Index futures as well.

I suspect we won't see strong underlying action until Yellen is done speaking, it's been very dull this morning, but starting to pick up a bit

Market Update, IWM & SRTY

There's not much moving in the market averages in 3C, it's obvious there's some caution in intraday charts, I have noticed some deterioration in slightly longer charts such as 3-5 min as seen in Index futures last night, especially in the SPY. Otherwise it looks just as dull as price generally.

However I still REALLY like the SRTY (Russell 3000 3x short) trading long position. Yesterday I pointed out what I believe is a channel buster and I want to highlight this chart one more time.

 IWM apparent (bearish) channel buster with a 5 min leading negative divergence, hence I still really like SRTY and still have that as an open long trading position at just about a flat return at the moment.

This is 5 min TF/ Russell 2000 Futures with that 5 min negative divegrence in the Index Futures.

I would set some alerts on IWM, if it breaks back in to the channel on the downside, there's a high probability that it falls to the bottom of that channel very fast, maybe further.

GLD / GDX

Obviously with all of the Central bank chatter from Japan to China to Europe and of course right in the middle of D.C. today with Yellen, gold is an asset that has been sensitive to QE historically, there seems to be either a counter trend bounce of some size developing or a stronger "bullish" market, right now we are more in a basing area.

I like GDX (gold miners) and gold, but with the 5 min futures negative divergence last night, I wanted to take a closer look. My gut feeling right now is that I'd prefer to exit the GLD/GDX positions sooner than later (December Calls) and look at both closer to their recent bases. The reason? I think there's something real there for both gold and miners, but I'd rather trade them on their merits rather than rumor, "maybe's" or confirmation hearings, they just don't have the kind of support that I trust especially after watching the ECB and Euro over the last 2 weeks, spike and flop.


 This is a 60 min GLD chart, note the reversal "Process". The most recent bottom looked real, supported and even had a head fake move, the gap up in to a large gap area is a tough spot, I'd say if gold sees significant upside from here without filling today's gap, it will be on Central Bank news (Yellen).

 This is the 60 min chart of gold futures, like I said, this bottom looks real and supported

This is the same strength on the 60 min GLD chart so that's good confirmation, but it's the intermediate charts that aren't strong which means a gap fill is likely (given there isn't F_E_D news) which is an oxy-moronic thought today.

 This is the 5 min negative in Gold futures since last night.

We haven't seen the same in GLD yet on this 3 min chart, but GLD just opened and the 5 min negative was after hours in gold futures and overnight, so GLD would need time to confirm the same signal.

GDX has been trading close to gold recently, but very recently there's been a little more of a disconnect and that's not surprising given all of the Central bank chatter.

 However, there's a good base in GDX as well- 2 hour chart

However this 15 min is about the strongest / longest chart right now, it doesn't give me a lot of confidence unless there's improvement fast.

The 5 min chart shows a strong leading positive sending GDX higher, you can see it in NUGT too...
NUGT 5 min leading positive.

However, if it doesn't start to show some stronger/longer chart support, I'd like to look at exiting on any strength , especially if it is Yellen induced, then re-group.

The Core long NUGT position is going to stay in place, it is meant for a longer term trade, I'm specifically talking about trading positions, options or even NUGT if it was entered as a trading position rather than a longer term position.