Wednesday, February 5, 2014

Adding to MCP $5 Calls

I prefer March for Calls.


Market Update

I'm still being patient, there's no point in trading lateral chop anyway. It looks like an intraday pullback is on its way, this after the "W" pattern just completed. The pullback doesn't look like anything of much interest, although those additional leading positive divergences I'd like to see would most likely appear during a pullback, smart money doesn't chase prices higher.


SPY as an example
 Yesterday we had the pattern in white, it was clear it was too distorted to be a wider "U" shape so a "W" base made sense, the yellow arrows are today's action forming that "W" base.

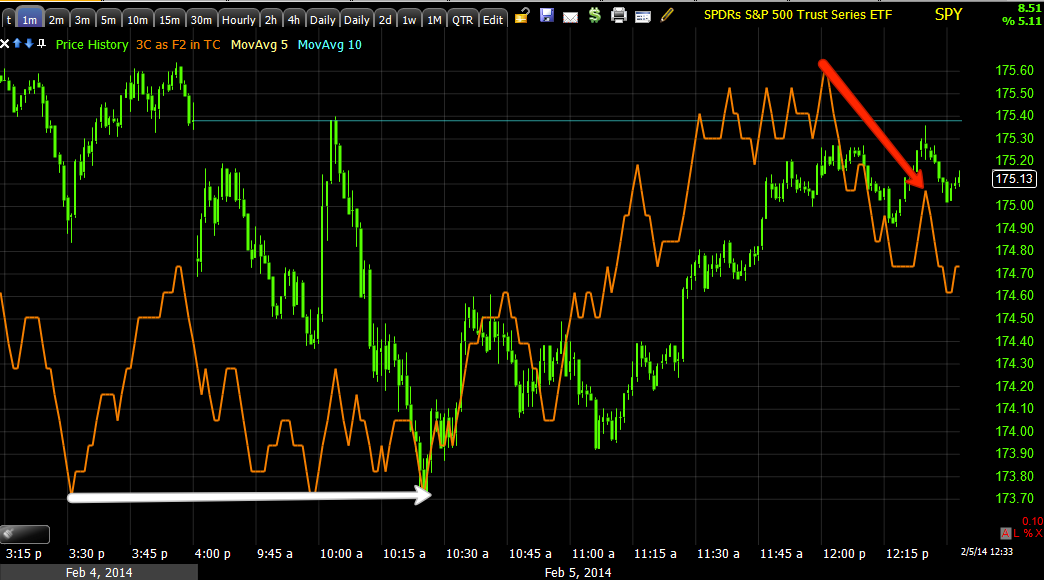
This is a 1 min SPY intraday that has moved up to form the "W" or complete it, there are some small intraday 1 min negatives in the area as you can see above.

The 2 min chart shows the second half of the "W" being stronger than the first half which is a normal progression for a divergence.

The 3 min chart is leading positive and looks good or off to a good start for today's action.

The 15 min chart also shows a stronger divergence today than yesterday.

The bigger picture with last week's range gives us a 39 min positive which is a pretty powerful signal and it's clearly positive, a little more on 3C and we'd have a stronger leading positive.

I can't imagine having a 30 min positive divergence and it not firing price to the upside.

 The end result for the Q's also gives us a 30 min positive

As well as the IWM (15 min positive).

It's still very short term timing charts I'm patiently waiting for, I don't want to enter early and be caught in a range or worse.

Closing the AAPL $510 Put from yesterday

I still don't like the way the charts look, but I can't see this market moving up and AAPL moving down.

My initial thinking was March puts were long enough that I'd still have time to catch AAPL on the way back down after a bounce, but it doesn't make sense to me to have that opportunity cost that long so I'm going to take the -12% put loss and just close it for now.

MCP Trade Update

MCP is also getting to be very hard to ignore, it made the move this morning that I said to look for in yesterday'a post.

I suppose if you like setting limit/buys (which I never like to do, I never want anyone seeing what I'm going to do until I do it-market wise), then the $4.69-$4.70 level would probably be the area in which I'd place the buy limit.

As for the charts, you already know (see yesterday's post) that the 30/60 min are exceptionally strong, it was just a matter of linking the short and intermediate charts with positive divergences which was happening yesterday and continues to happen today.
 The 1 min chart is doing what it should, but not convincing me that the timing is right to pull the trigger, but that can happen very fast, in fact in the time it takes me to write this post.

The 2 min chart looks solid, I'd like to see it lead like the blue arrow I drew in.

The 3 min chart is leading, the area in the white box is what I'm watching for an even stronger move up.

And the 5 min has been leading positive since yesterday, this is the first intraday institutional timeframe so it seems there was a lot of strong underlying trade late yesterday.

The 10 min chart is the link, it's positive, but I'd really like to see this lead as well.

MCP will likely move with the market initially, but this is a longer term trade, it is not a market correlated bounce. MCP has its own legs and I suspect it will move to a stage 2 base over the next several months despite what the market is doing.

This is one of my favorite longer term (long) positions.

VIX Update

This was yesterday's post on VIX shorts possibly coming up today and last night I showed several charts with my custom buy/sell indicator with a VIX sell.

I'm actually right on the verge of a VXX short or put, I just feel like I need a little bit more.

 VXX 1 min intraday negative

3 min negative

5 min leading negative

VIX futures 1 min are in line, but ...

The 5 min have been horrible.

I'm not exactly sure what I'm looking for, usually when VIX fires a signal, it's even more amazing than some of these, perhaps the 1 min  Futures going negative?

In any case, in almost any other asset I'd already be short here, but something is just telling me to be patient for a bit longer, if I miss the trade there will be another right around the corner.

Don't forget, VIX moves opposite the market so if we are seeing 3C deterioration in VIX, that's a good thing for the market, of course these are shorter term signals, maybe a swing type trade.

Quick Update

So far the area for a "W" base looks about right...

 SPY "W"

QQQ "W"

 Initial signals look pretty good, SPY 1m

SPY 2 m

QQQ 1m

IWM 1m

We just need to see everything solidify up here.

MCP Update

Here's MCP doing exactly what I was talking about in yesterday's MCP Trade Update.

If this gave a sharper move down and the signals stayed strong, I'd consider adding to MCP calls. I can't add anymore to MCP equity longs, but I think it's still a nice looking position for a longer trend long trade.

MCP is just breaking under that flat range I was pointing out yesterday, it hit stops as well, check the volume.

A decent entry would likely be on a move back above the $4.68 area, the higher it moves above the area the higher the probabilities, but the worse your entry. I have alerts set at each of the areas between here and $4.68 so I'll continue checking it. I'd think MCP would be ready to go about the same time as the market, keep watching for that "W" to complete.

This May Be It

The Yen is getting crushed, USD/JPY is starting to fly.

Early Update

Good morning,

So far the averages hand Index futures have a weak enough intraday start that they should be able to make it a bit lower and form that "W" base.

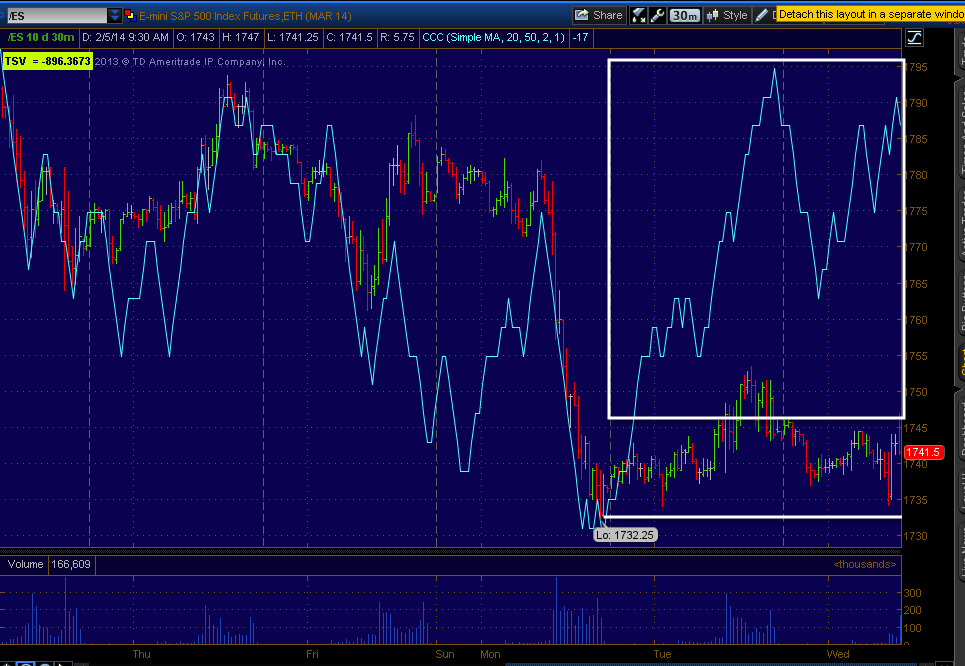
The longer charts are still plenty strong enough to launch them higher after that is completed, at least that's what I suspect the market is going for. Here's an example using SPX futures ...
 To the far right is this morning's regular hours open with a 1 min negative divegrence and the averages have the same which should bring them closer to the "W" bottom.

At 5 min I wanted to see this chart improve and it has considerably so it looks ready to support a base.

The more important chart and you can see the "W" more clearly is this 30 min which is also strong, the averages are similar to the SPX futures as far as charts.

Currencies looked like they were about to (actually did start) to strengthen on the US open, the USD/JPY specifically, now it's kind of in limbo, seemingly waiting, but I want to keep a close eye on that as it's really running the show.

In any case, we opened at a decent spot to create that "W" base, lets see what happens, it shouldn't take much more than half the day I would think.

Tuesday, February 4, 2014

Twitter Sentiment

Our resident sentiment follower sent me a bunch of Twitter "tweets" summing up sentiment of retail that he follows for us, put it this way, "Buy the Dip" is gone, it's now "Short thee rip" which is good as retail is usually on the wrong side of market sentiment".